
- Title
-
A pathogenic mechanism associated with myopathies and structural birth defects involves TPM2 directed myogenesis
- Authors
- McAdow, J., Yang, S., Ou, T., Huang, G., Dobbs, M.B., Gurnett, C.A., Greenberg, M.J., Johnson, A.N.
- Source
- Full text @ JCI Insight
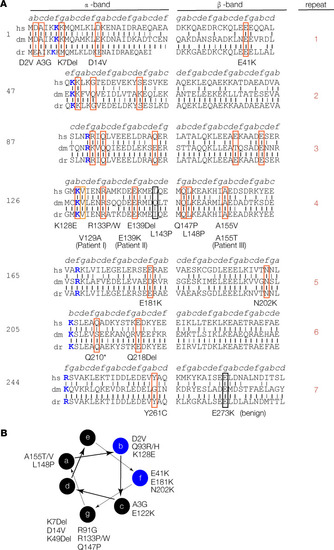
TPM2 residues associated with pathogenic variants are conserved. (A) TPM2 conservation and sequence structure. TPM2 protein sequence divided into 7 quasi-repeats, split into α- and β-bands as described before (26). Actin-binding residues are colored blue. Vertical black lines show identical residues between the human (hs), Drosophila (dm), or zebrafish (dr) proteins; gray lines show similar residues. A total of 25 pathogenic TPM2 coding region variants have been reported (19). We identified 2 potentially novel variants (V129A and E139K) and 1 recurring variant (A155T) in patients with musculoskeletal birth defects. Variants affecting conserved residues are boxed in red; nonconserved pathogenic variants are boxed in black. (B) Conserved pathogenic variants disproportionately cluster to a single topographical position. Diagram showing the 7–amino acid heptad (a–g) of the TPM2 coiled-coil, as described (). A subset of b and f residues binds actin (blue circles). There are 7 conserved pathogenic variants mapped to residues in position g. |
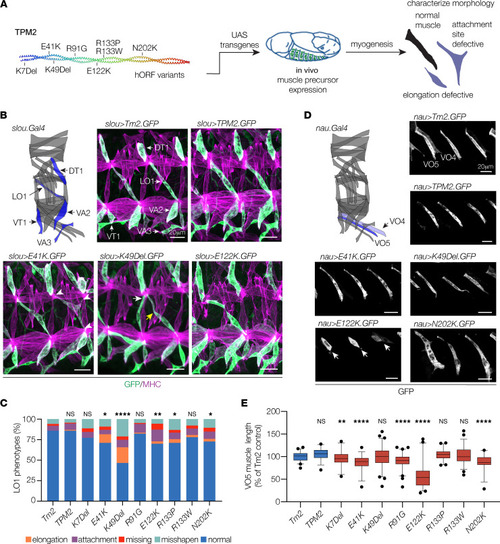
TPM2 variants disrupt muscle development in Drosophila. (A) Transgenic expression assays used to characterize the effects of TPM2 variants on myogenesis. (B and C) TPM2 variants caused multiple phenotypes in slou-expressing muscles. (B) Diagram showing the 30 body wall muscles in an embryonic hemisegment; slou.Gal4-expressing muscles are shown in blue (modeled after ref. 7). Confocal micrographs of stage 16 embryos that expressed GFP-tagged Drosophila Tropomyosin 2 (Tm2), wild-type human TPM2, or pathogenic TPM2 variants (green), colabeled with myosin heavy chain (MHC, violet). Two hemisegments are shown for each embryo. Variant-expressing LO1 muscles showed multiple phenotypes, including rounded muscles (elongation), muscles attached to an incorrect tendon (wrong tendon, white arrows), muscles attached to 3 tendons (multiple tendons, white arrowheads), muscles absent from a segment (missing), and muscles with bent or hook-shaped morphology (misshapen; yellow arrows). (C) Histogram of variant phenotypes. (D and E) TPM2 variants reduced muscle length in nau-expressing muscles. (D) The nau.Gal4-expressing muscles are diagramed in blue. Confocal micrographs of stage 16 embryos that expressed GFP-tagged transgenes, labeled for GFP. Variant-expressing VO5 muscles were short or rounded, but other parameters of muscle morphology were largely normal. E122K expressing muscles showed the strongest phenotype (white arrows). GFP expression in VO4 muscles was highly variable. (E) Box plot showing VO5 length normalized to Tm2-expressing control. Significance versus Tm2-expressing muscles was determined by Fisher’s exact test (C) or 1-way ANOVA (E). Error bars, standard error of the mean (SEM). *(P < 0.05), **(P < 0.01), ***(P < 0.001), ****(P < 0.0001). n ≥ 66 muscles per variant; minimum 9 embryos per variant. Scale bars, 20 μm. |
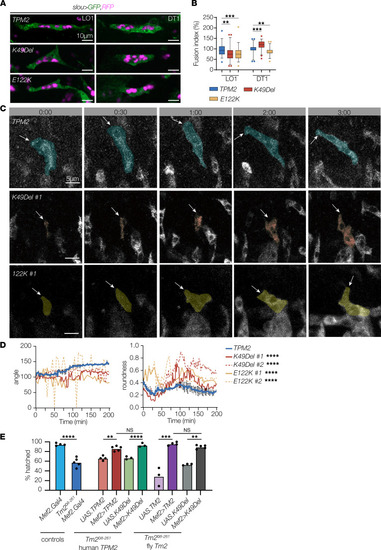
TPM2 variants disrupt myoblast fusion and myotube guidance. (A) Myoblast fusion assays. Confocal micrographs of stage 16 embryos that expressed cytoplasmic EGFP (green), nuclear RFP (violet), and wild-type or variant TPM2 under the control of slou.Gal4. DT1 and LO1 muscles that expressed K49Del or E122K showed a substantial change in the number of myonuclei compared with controls. The number of myonuclei in other slou-expressing muscles was unaffected. (B) Quantification of myoblast fusion. Fusion index indicates altered myoblast fusion in variant-expressing myotubes. n ≥ 45 myotubes per variant; minimum 8 embryos per variant. (C) Live imaging stills of LO1 myotubes in stage 12–15 embryos that expressed GFP-tagged TPM2. Transgene expression was controlled by slou.Gal4. Live imaging initiated when GFP fluorescence was first detected (0min). Dorsal leading edges (arrows) of control myotubes elongated to the dorsal anterior of the segment. Dorsal leading edges of variant-expressing myotubes failed to elongate or elongated toward the posterior of the segment. #:## (hr:min). (D) Quantification of myotube guidance. Control myotubes showed a stable myotube angle (consistent elongation toward a muscle attachment site) and a low roundness score (more linear). Variant-expressing myotubes showed fluctuating myotube angles and a high roundness score (more circular). (E) Hatching assays. Tm2Δ8-261 homozygous embryos had significantly lower hatching rates than controls (blue bars). Tm2Δ8-261 embryos that expressed human TPM2 or Drosophila Tm2 under the control of Mef2.Gal4 showed significantly improved hatching rates compared with Tm2Δ8-261 embryos (red and violet bars). Tm2Δ8-261 embryos that expressed K49Del also showed a significant improvement in hatching rates (green and gray bars), but hatching rates were comparable between Tm2Δ8-261 embryos that expressed wild-type or K49Del variants. Significance was determined by 1-way ANOVA (B and E) or unpaired, 1-tailed Student’s t test (D). Error bars, SEM. **(P < 0.01), ***(P < 0.001), ****(P < 0.0001). Scale bars, 10 μm (A), 5 μm (C). |
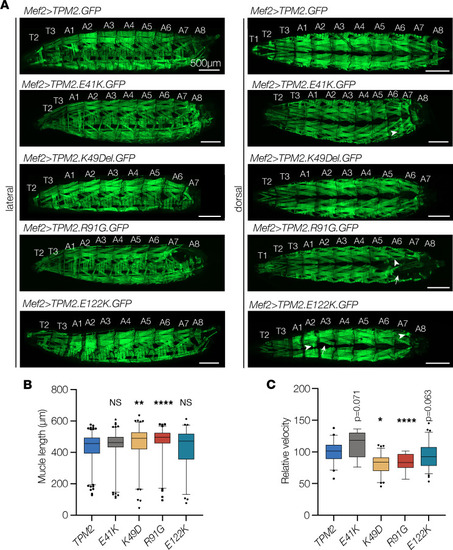
TPM2 variants disrupt muscle function in Drosophila. (A–C) Larvae that expressed TPM2 variants showed abnormal muscle morphology and impaired muscle function. (A) Confocal micrographs of live L3 larvae that expressed GFP-tagged TPM2 or pathogenic TPM2 variants (green) under the control of Mef2.Gal4. Larvae that expressed pathogenic variants often lacked muscles in segment A8. Muscles were also misshapen (arrowheads) or missing (arrow) in variant-expressing larvae. (B) Dorsal oblique muscle length (A2–A8). Muscles that expressed K49Del or R91G were significantly longer than controls. n ≥ 76 muscles per genotype. (C) Larval locomotion assays. Larvae that expressed K49Del or R91G were significantly slower than controls. n ≥ 9 larvae per genotype. Significance was determined by Kruskal-Wallis test. Error bars, SEM. *(P < 0.05), **(P < 0.01), ****(P < 0.0001). Scale bars, 500 μm. |
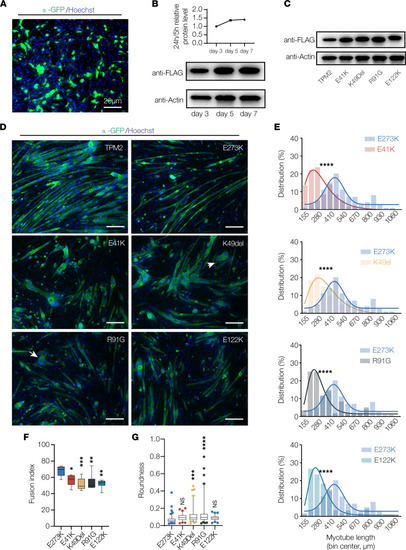
TPM2 variants disrupt myotube morphogenesis. (A) Transfection efficiency. C2C12 myoblasts were transfected with TPM2.IRES.GFP and imaged 24 hours posttransfection. About 25% of cells were GFP positive. (B) Western blot of TPM2 expression. C2C12 cells were transfected with Flag-TPM2 and collected after 3, 5, and 7 days of differentiation. (C) Western blot of TPM2 variants. C2C12 cells were transfected with Flag-tagged variants and collected after 7 days of differentiation. Protein expression was similar among the variants. (D) C2C12 cells transfected with pathogenic TPM2 variants showed impaired morphology. Confocal micrographs of cells fixed after 7 days in differentiation media and labeled for α-actinin (green) to detect differentiated myotubes and Hoechst to visualize myonuclei. Myotubes that expressed E41K, K49Del, R91G, and E122K appeared shorter than controls (wild-type TPM2 and the benign variant E273K). Variant-expressing myotubes were often rounded (arrows). Scale bars, 20 μm. (E) Myotube length distribution showing Gaussian distribution fit curves (solid lines). The length distribution of myotubes that expressed pathogenic variants skewed toward shorter lengths. (F) Quantification of myoblast fusion. Fusion index represents the number of nuclei in multinucleate myotubes; variant-expressing cells fused less than controls. (G) Roundness score. Individual myotubes were traced to calculate roundness; a score of 1.0 represents complete circularity. Myotubes that expressed K49Del and R91G were more round than controls. Significance was determined by unpaired, 1-tailed Student’s t test (E) or 1-way ANOVA (F and G). n ≥ 10 imaging fields per treatment. *(P < 0.05), **(P < 0.01), ***(P < 0.001), ****(P < 0.0001). Error bars, SEM. |
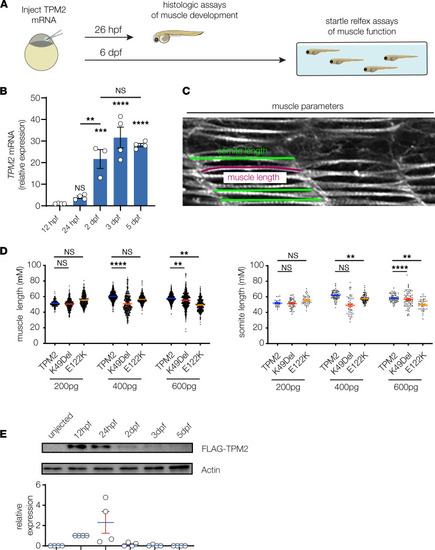
Transient overexpression assays in zebrafish. (A) Transient expression assays were used to characterize myogenic defects in zebrafish that expressed TPM2 variants. One cell stage embryos were injected with control or variant-encoding mRNAs and raised under standard conditions to 26 hours postfertilization (hpf) for histological assays or to 6 days postfertilization (dpf) for locomotor assays. (B) Quantitative real-time PCR of zebrafish TPM2 in wild-type embryos, normalized to 12 hpf. n = 4 larvae per sample; 3–4 replicates are shown. (C) Histologic measurements of 26 hpf larvae. Individual slow muscle fibers were traced in ImageJ (NIH) to determine muscle length (magenta line). Somite size was measured 3 times per somite and then averaged to calculate somite length. (D) Pathogenic TPM2 variants caused dose-dependent defects in myofiber length and somite length. A gradient of mRNA doses were injected (200 pg, 400 pg, and 600 pg), and muscle morphology was assessed at each concentration. A dose of 600 pg produced consistent phenotypes in variant-expressing larvae but not in wild-type expressing larvae. Each data point represents an individual muscle fiber or somite. n ≥ 20 larvae per condition. (E) Western blot of injected TPM2. One-cell stage embryos were injected with 600 pg Flag-TPM2 mRNA, and lysates were collected at 12 hpf, 24 hpf, 2 dpf, 3 dpf, and 5 dpf. Robust TPM2 expression was detectable at 12 hpf and 24 hpf. Each data point graphed represents relative expression from 1 independent clutch. n ≥ 30 animals per sample; 4 replicates are shown. Significance was determined by unpaired, 1-tailed Student’s t test versus wild-type TPM2–injected fish. **(P < 0.01), ***(P < 0.001), ****(P < 0.0001). Error bars, SEM. |
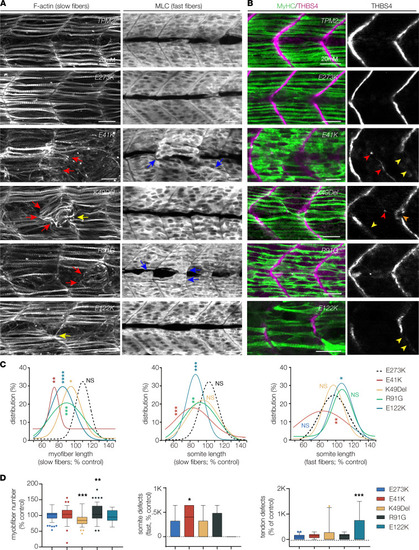
Pathogenic TPM2 variants disrupt myogenesis in zebrafish. (A) Larvae that expressed pathogenic variants showed defects in muscle morphogenesis. Confocal micrographs of slow-twitch myofibers (left, F-actin) and fast-twitch myofibers (right, myosin light chain) in 26 hpf larvae injected at the 1-cell stage. Variant-expressing larvae showed multiple slow fiber phenotypes, including short fibers (red arrows) and fibers that clustered to a single attachment site (yellow arrowheads). Fast-twitch fiber morphology was largely normal in larvae that expressed pathogenic variants, although some larvae showed disorganized fast fibers (blue arrows). Larvae that expressed wild-type TPM2 or the benign variant E273K had morphologically normal slow and fast fibers. (B) Larvae that expressed pathogenic variants showed defects in myosepta morphology. Confocal micrographs of 26 hpf larvae injected at the 1-cell stage, labeled for slow myofiber myosin heavy chain (MyHC, green) and the myosepta tendon marker Thrombospondin 4 (THBS4, violet). Variant-expressing larvae showed multiple phenotypes, including tendons that developed in the center of the somite (red arrowhead), bifurcated myosepta (orange arrowheads), and myosepta with broken thrombospondin expression (yellow arrowheads). The frequency of tendon phenotypes was substantial only for E122K. (C) Gaussian distribution fit curves. Length distributions in larvae that expressed pathogenic variants skewed toward shorter lengths for slow fibers but were less affected for fast fibers. n ≥ 48 somites per treatment. (D) Box plots showing slow fiber number and the frequency of morphology defects in fast muscle and myosepta. Larvae that expressed K49Del and R91G had significantly fewer slow fibers than larvae that expressed E273K. Morphology defects were restricted to E41K-expressing larvae (fast fibers) and E122K-expressing larvae (myosepta). n ≥ 11 larvae per treatment. Scale bars, 20 μm. Significance was determined by unpaired, 1-tailed Students t test (C) and 1-way ANOVA (D). *(P < 0.05), **(P < 0.01), ***(P < 0.001), ****(P < 0.0001). Error bars, SEM. |
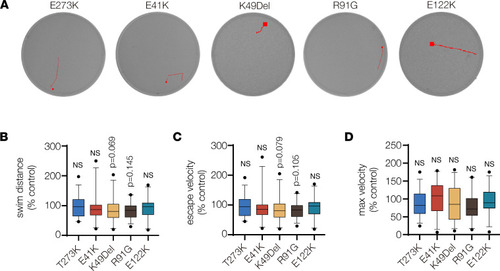
TPM2 variants did not affect swim function. (A) Automated tracking of the startle response in 6 dpf larvae. EthoVision imaging software (Noldus) tracked larvae for 3 seconds after a mechanical stimulus. Red lines show the locomotor path of representative larvae. Endpoints are marked by a square. (B–D) Box plots showing swim function. The startle response in larvae that expressed E41K, K49Del, R91G, and E122K was not significantly different from larvae that expressed the benign variant E273K. Swim distance, average escape velocity, and maximum velocity of larvae that expressed TPM2 variants were reported by imaging software and normalized to larvae that expressed wild-type TPM2. Significance was determined by 1-way ANOVA. n ≥ 25 larvae per treatment. Error bars, SEM. |
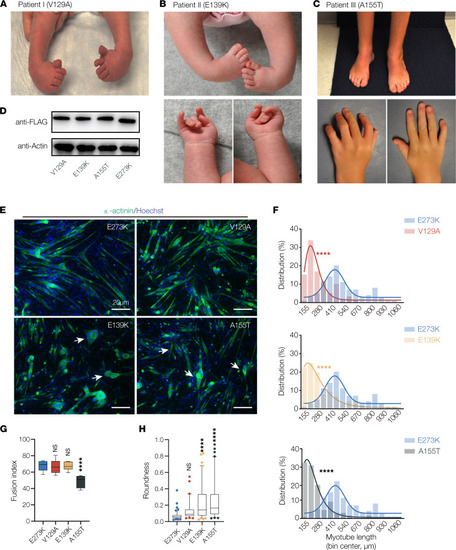
TPM2 variants identified in patients with musculoskeletal disorders disrupt myotube morphogenesis. (A) Clinical features of patient I, diagnosed with bilateral clubfoot (shown here before treatment). (B and C) Clinical features of patient II and patient III, diagnosed with DA1. Photos for patient II show clubfoot before treatment, and photos of patient III show bilateral clubfoot after treatment. Individual III also developed lower extremity weakness as a child. Patient I and patient II are heterozygous for the novel variants V129A and E139K; patient III is heterozygous for the recurring variant A155T. (D) Western blot of TPM2 variants. C2C12 cells were transfected with Flag-tagged variants and collected after 7 days of differentiation. Protein expression was similar among V129A, E139K, and A155T. (E) C2C12 cells transfected with pathogenic TPM2 variants showed defective morphology. Confocal micrographs of cells fixed after 7 days in differentiation media and labeled for α-actinin (green) to detect differentiated myotubes and Hoechst to visualize myonuclei. Myotubes that expressed V129A, E139K, and A155T appeared shorter than controls expressing the benign variant E273K. Variant-expressing myotubes were often rounded (arrows). Scale bars, 20 μm. (F) Myotube length distribution showing Gaussian distribution fit curves (solid lines). The length distribution of myotubes that expressed V129A, E139K, and A155T skewed toward shorter lengths. (G) Quantification of myoblast fusion. Fusion index represents the number of nuclei in multinucleate myotubes; cells that expressed A155T fused less than controls. (H) Roundness score. Individual myotubes were traced to calculate roundness; a score of 1.0 represents complete circularity. Myotubes that expressed E139K and A155T were more round than controls. Significance was determined by unpaired, 1-tailed Student’s t test (E) or 1-way ANOVA (F and G). n ≥ 10 imaging fields per treatment. ****(P < 0.0001). Error bars, SEM. |
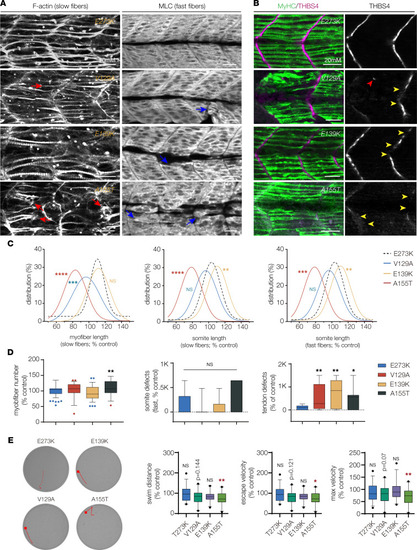
TPM2 variants disrupt myogenesis and muscle function. (A) Larvae that expressed V129A, E139K, and A155T showed defects in muscle morphogenesis. Confocal micrographs of slow-twitch myofibers (left, F-actin) and fast-twitch myofibers (right, myosin light chain) in 26 hpf larvae injected at the 1-cell stage. Variant-expressing larvae had phenotypes including short slow fibers (red arrows) that often clustered at the center of the somite and disorganized fast fibers (blue arrows). Larvae that expressed wild-type TPM2 or the benign variant E273K had morphologically normal myofibers. (B) Larvae that expressed V129A, E139K, and A155T showed defects in myosepta morphology. Confocal micrographs of 26 hpf larvae injected with TPM2 RNAs at the 1-cell stage, labeled for slow myofiber myosin heavy chain (MyHC, green) and the myosepta tendon marker Thrombospondin 4 (THBS4, violet). Larvae that expressed pathogenic variants developed tendons in the center of the somite (red arrowhead) and showed broken thrombospondin expression (yellow arrowheads). (C) Gaussian distribution fit curves. Slow fiber length distributions in larvae that expressed V129A and A155T skewed toward shorter lengths. Somite size was smaller in larvae that expressed A155T and longer in larvae that expressed E139K. n ≥ 48 somites per treatment. (D) Box plots quantifying myofiber number and morphology defects. Larvae that expressed A155T had significantly fewer slow fibers than larvae that expressed E273K. Morphology defects were restricted to myosepta in larvae that expressed V129A, E139K, and A155T. n ≥ 7 larvae per treatment. (E) Automated tracking of the startle response in 6 dpf larvae, as described in Figure 8. Larvae that expressed A155T had reduced startle responses compared with E273K larvae. n ≥ 24 larvae per treatment. Swim parameters were normalized to larvae that expressed wild-type TPM2. Significance was determined by unpaired, 1-tailed Student’s t test (C) and 1-way ANOVA (D and E). *(P < 0.05), **(P < 0.01), ***(P < 0.001), ****(P < 0.0001). Error bars, SEM. |
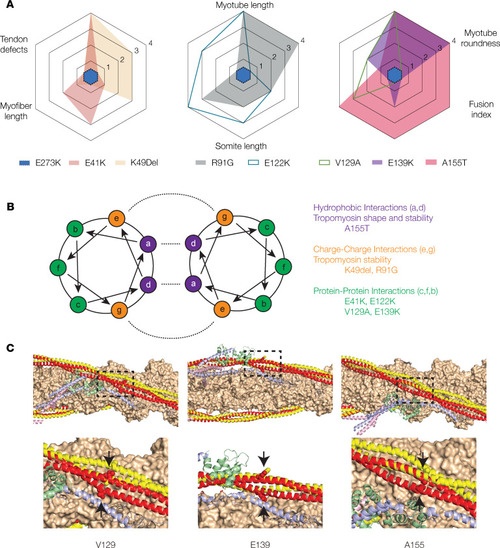
The impact of TPM2 variants on musculoskeletal development correlates with intermolecular interactions. (A) A155T induced the most significant phenotypes among the TPM2 variants tested. Radar plots of C2C12 cell and zebrafish phenotypes. Each assay was scored using statistical significance: 0 (not significant), 1 (P < 0.05), 2 (P < 0.01), 3 (P < 0.001), 4 (P < 0.0001). The score for each assay is graphed for each variant tested. E273K has a score of 0 for all assays. (B) Helical wheel model with described residues depicting the Tropomyosin dimer. Intermolecular interactions are shown with dashed lines. A155T occurs at a residue expected to promote hydrophobic interactions. (C) Thin filament structure involving potentially novel and recurring TPM2 variants mapped onto the structure of the cardiac thin filament. Actin (orange), troponin I (blue), troponin C (green), and troponin T (pink) are shown from the low-calcium Cryo-EM structure (Protein Data Bank [PDB] 6KN7). Tropomyosin is shown in the low-calcium (red) and high-calcium (yellow) states, based on PDB 6KN7 and 6KN8, respectively. The mutated residues are shown as spheres (arrows). |