
|
Fig. 7
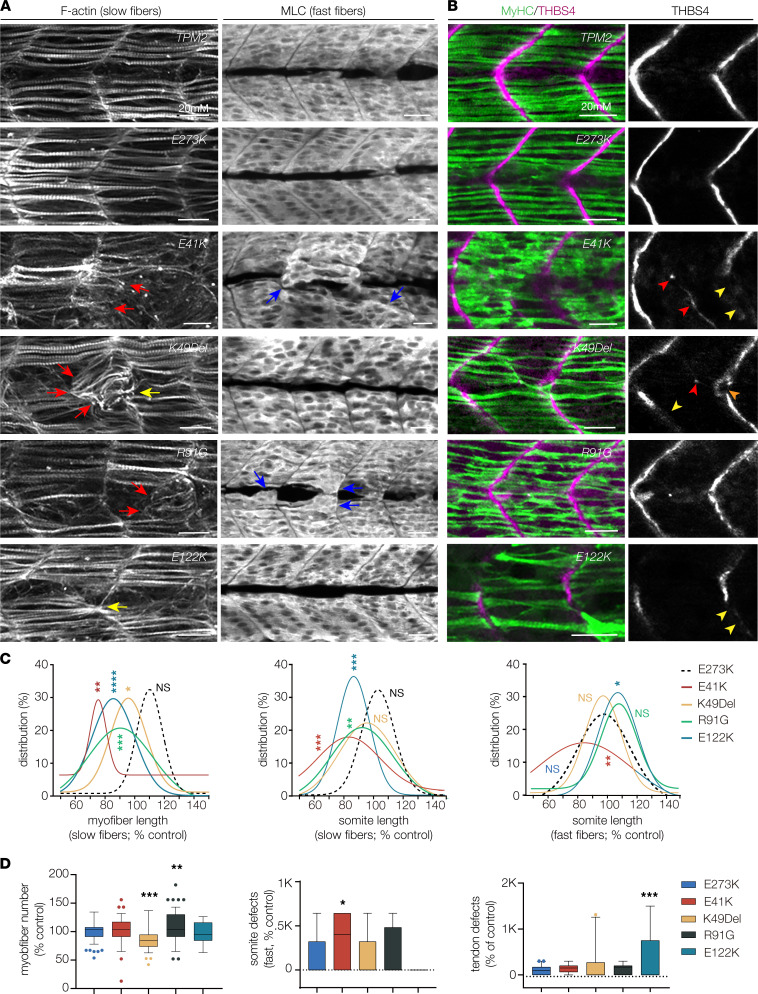
Pathogenic TPM2 variants disrupt myogenesis in zebrafish. (A) Larvae that expressed pathogenic variants showed defects in muscle morphogenesis. Confocal micrographs of slow-twitch myofibers (left, F-actin) and fast-twitch myofibers (right, myosin light chain) in 26 hpf larvae injected at the 1-cell stage. Variant-expressing larvae showed multiple slow fiber phenotypes, including short fibers (red arrows) and fibers that clustered to a single attachment site (yellow arrowheads). Fast-twitch fiber morphology was largely normal in larvae that expressed pathogenic variants, although some larvae showed disorganized fast fibers (blue arrows). Larvae that expressed wild-type TPM2 or the benign variant E273K had morphologically normal slow and fast fibers. (B) Larvae that expressed pathogenic variants showed defects in myosepta morphology. Confocal micrographs of 26 hpf larvae injected at the 1-cell stage, labeled for slow myofiber myosin heavy chain (MyHC, green) and the myosepta tendon marker Thrombospondin 4 (THBS4, violet). Variant-expressing larvae showed multiple phenotypes, including tendons that developed in the center of the somite (red arrowhead), bifurcated myosepta (orange arrowheads), and myosepta with broken thrombospondin expression (yellow arrowheads). The frequency of tendon phenotypes was substantial only for E122K. (C) Gaussian distribution fit curves. Length distributions in larvae that expressed pathogenic variants skewed toward shorter lengths for slow fibers but were less affected for fast fibers. n ≥ 48 somites per treatment. (D) Box plots showing slow fiber number and the frequency of morphology defects in fast muscle and myosepta. Larvae that expressed K49Del and R91G had significantly fewer slow fibers than larvae that expressed E273K. Morphology defects were restricted to E41K-expressing larvae (fast fibers) and E122K-expressing larvae (myosepta). n ≥ 11 larvae per treatment. Scale bars, 20 μm. Significance was determined by unpaired, 1-tailed Students t test (C) and 1-way ANOVA (D). *(P < 0.05), **(P < 0.01), ***(P < 0.001), ****(P < 0.0001). Error bars, SEM.