
Fig. 10
- ID
- ZDB-FIG-220623-89
- Publication
- McAdow et al., 2022 - A pathogenic mechanism associated with myopathies and structural birth defects involves TPM2 directed myogenesis
- Other Figures
- All Figure Page
- Back to All Figure Page
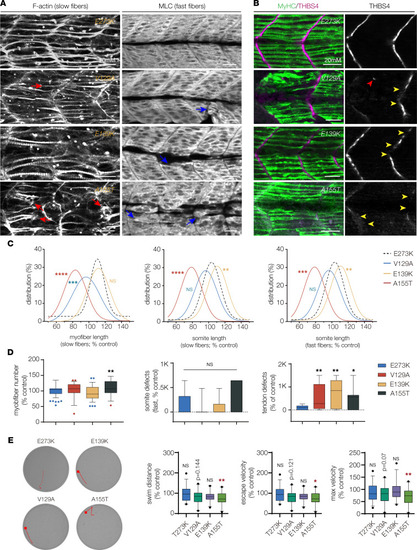
TPM2 variants disrupt myogenesis and muscle function. (A) Larvae that expressed V129A, E139K, and A155T showed defects in muscle morphogenesis. Confocal micrographs of slow-twitch myofibers (left, F-actin) and fast-twitch myofibers (right, myosin light chain) in 26 hpf larvae injected at the 1-cell stage. Variant-expressing larvae had phenotypes including short slow fibers (red arrows) that often clustered at the center of the somite and disorganized fast fibers (blue arrows). Larvae that expressed wild-type TPM2 or the benign variant E273K had morphologically normal myofibers. (B) Larvae that expressed V129A, E139K, and A155T showed defects in myosepta morphology. Confocal micrographs of 26 hpf larvae injected with TPM2 RNAs at the 1-cell stage, labeled for slow myofiber myosin heavy chain (MyHC, green) and the myosepta tendon marker Thrombospondin 4 (THBS4, violet). Larvae that expressed pathogenic variants developed tendons in the center of the somite (red arrowhead) and showed broken thrombospondin expression (yellow arrowheads). (C) Gaussian distribution fit curves. Slow fiber length distributions in larvae that expressed V129A and A155T skewed toward shorter lengths. Somite size was smaller in larvae that expressed A155T and longer in larvae that expressed E139K. n ≥ 48 somites per treatment. (D) Box plots quantifying myofiber number and morphology defects. Larvae that expressed A155T had significantly fewer slow fibers than larvae that expressed E273K. Morphology defects were restricted to myosepta in larvae that expressed V129A, E139K, and A155T. n ≥ 7 larvae per treatment. (E) Automated tracking of the startle response in 6 dpf larvae, as described in Figure 8. Larvae that expressed A155T had reduced startle responses compared with E273K larvae. n ≥ 24 larvae per treatment. Swim parameters were normalized to larvae that expressed wild-type TPM2. Significance was determined by unpaired, 1-tailed Student’s t test (C) and 1-way ANOVA (D and E). *(P < 0.05), **(P < 0.01), ***(P < 0.001), ****(P < 0.0001). Error bars, SEM. |