
|
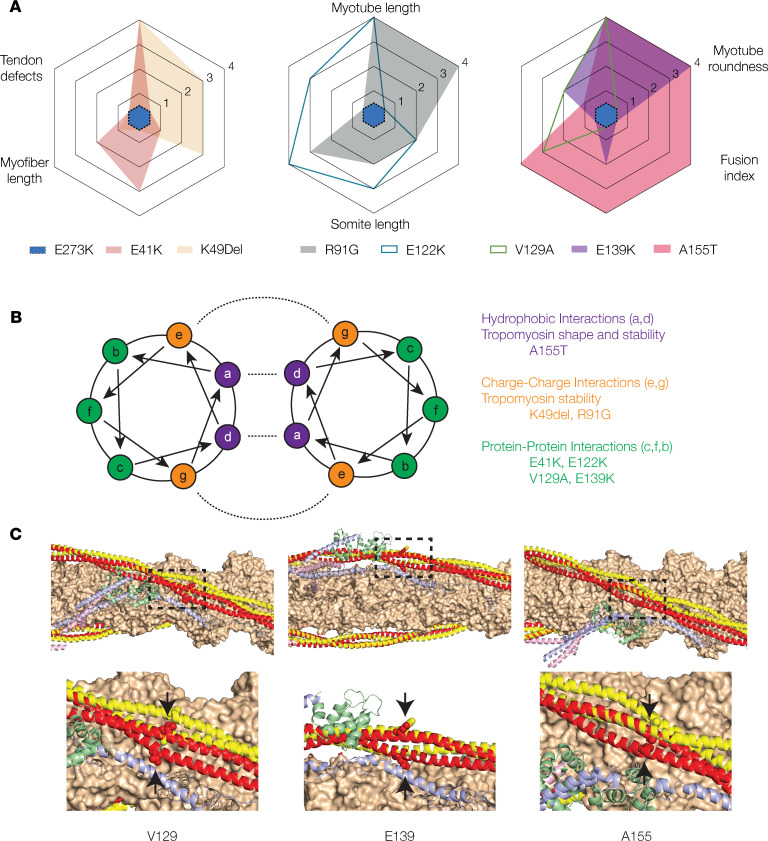
Fig. 11
The impact of TPM2 variants on musculoskeletal development correlates with intermolecular interactions. (A) A155T induced the most significant phenotypes among the TPM2 variants tested. Radar plots of C2C12 cell and zebrafish phenotypes. Each assay was scored using statistical significance: 0 (not significant), 1 (P < 0.05), 2 (P < 0.01), 3 (P < 0.001), 4 (P < 0.0001). The score for each assay is graphed for each variant tested. E273K has a score of 0 for all assays. (B) Helical wheel model with described residues depicting the Tropomyosin dimer. Intermolecular interactions are shown with dashed lines. A155T occurs at a residue expected to promote hydrophobic interactions. (C) Thin filament structure involving potentially novel and recurring TPM2 variants mapped onto the structure of the cardiac thin filament. Actin (orange), troponin I (blue), troponin C (green), and troponin T (pink) are shown from the low-calcium Cryo-EM structure (Protein Data Bank [PDB] 6KN7). Tropomyosin is shown in the low-calcium (red) and high-calcium (yellow) states, based on PDB 6KN7 and 6KN8, respectively. The mutated residues are shown as spheres (arrows).