
Fig. 3
- ID
- ZDB-FIG-220623-82
- Publication
- McAdow et al., 2022 - A pathogenic mechanism associated with myopathies and structural birth defects involves TPM2 directed myogenesis
- Other Figures
- All Figure Page
- Back to All Figure Page
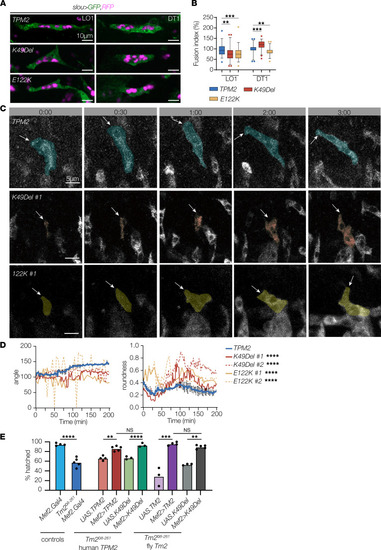
TPM2 variants disrupt myoblast fusion and myotube guidance. (A) Myoblast fusion assays. Confocal micrographs of stage 16 embryos that expressed cytoplasmic EGFP (green), nuclear RFP (violet), and wild-type or variant TPM2 under the control of slou.Gal4. DT1 and LO1 muscles that expressed K49Del or E122K showed a substantial change in the number of myonuclei compared with controls. The number of myonuclei in other slou-expressing muscles was unaffected. (B) Quantification of myoblast fusion. Fusion index indicates altered myoblast fusion in variant-expressing myotubes. n ≥ 45 myotubes per variant; minimum 8 embryos per variant. (C) Live imaging stills of LO1 myotubes in stage 12–15 embryos that expressed GFP-tagged TPM2. Transgene expression was controlled by slou.Gal4. Live imaging initiated when GFP fluorescence was first detected (0min). Dorsal leading edges (arrows) of control myotubes elongated to the dorsal anterior of the segment. Dorsal leading edges of variant-expressing myotubes failed to elongate or elongated toward the posterior of the segment. #:## (hr:min). (D) Quantification of myotube guidance. Control myotubes showed a stable myotube angle (consistent elongation toward a muscle attachment site) and a low roundness score (more linear). Variant-expressing myotubes showed fluctuating myotube angles and a high roundness score (more circular). (E) Hatching assays. Tm2Δ8-261 homozygous embryos had significantly lower hatching rates than controls (blue bars). Tm2Δ8-261 embryos that expressed human TPM2 or Drosophila Tm2 under the control of Mef2.Gal4 showed significantly improved hatching rates compared with Tm2Δ8-261 embryos (red and violet bars). Tm2Δ8-261 embryos that expressed K49Del also showed a significant improvement in hatching rates (green and gray bars), but hatching rates were comparable between Tm2Δ8-261 embryos that expressed wild-type or K49Del variants. Significance was determined by 1-way ANOVA (B and E) or unpaired, 1-tailed Student’s t test (D). Error bars, SEM. **(P < 0.01), ***(P < 0.001), ****(P < 0.0001). Scale bars, 10 μm (A), 5 μm (C). |