
|
Fig. 9
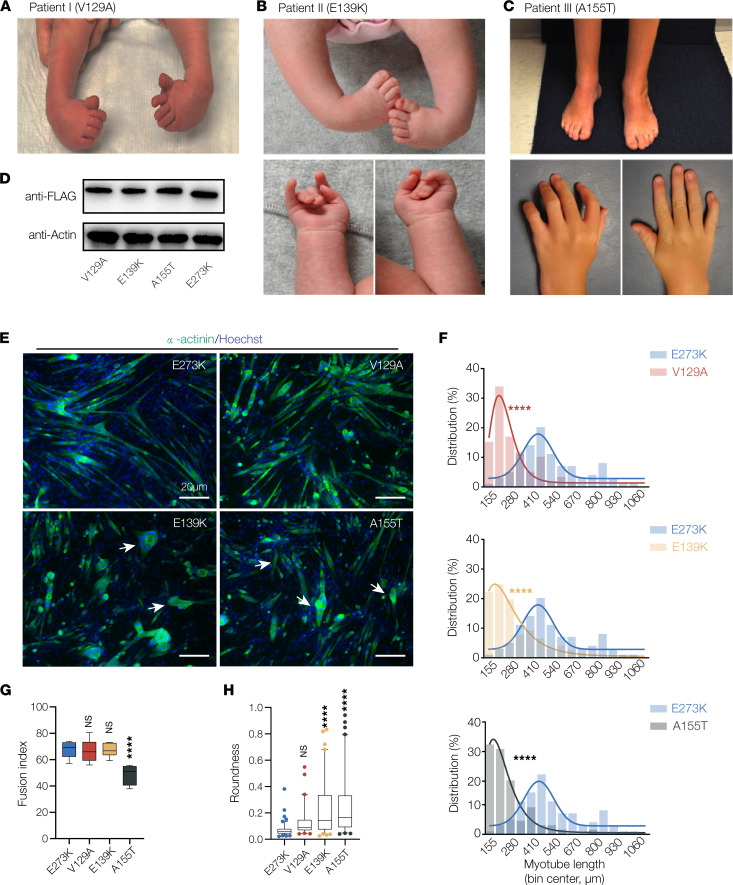
TPM2 variants identified in patients with musculoskeletal disorders disrupt myotube morphogenesis. (A) Clinical features of patient I, diagnosed with bilateral clubfoot (shown here before treatment). (B and C) Clinical features of patient II and patient III, diagnosed with DA1. Photos for patient II show clubfoot before treatment, and photos of patient III show bilateral clubfoot after treatment. Individual III also developed lower extremity weakness as a child. Patient I and patient II are heterozygous for the novel variants V129A and E139K; patient III is heterozygous for the recurring variant A155T. (D) Western blot of TPM2 variants. C2C12 cells were transfected with Flag-tagged variants and collected after 7 days of differentiation. Protein expression was similar among V129A, E139K, and A155T. (E) C2C12 cells transfected with pathogenic TPM2 variants showed defective morphology. Confocal micrographs of cells fixed after 7 days in differentiation media and labeled for α-actinin (green) to detect differentiated myotubes and Hoechst to visualize myonuclei. Myotubes that expressed V129A, E139K, and A155T appeared shorter than controls expressing the benign variant E273K. Variant-expressing myotubes were often rounded (arrows). Scale bars, 20 μm. (F) Myotube length distribution showing Gaussian distribution fit curves (solid lines). The length distribution of myotubes that expressed V129A, E139K, and A155T skewed toward shorter lengths. (G) Quantification of myoblast fusion. Fusion index represents the number of nuclei in multinucleate myotubes; cells that expressed A155T fused less than controls. (H) Roundness score. Individual myotubes were traced to calculate roundness; a score of 1.0 represents complete circularity. Myotubes that expressed E139K and A155T were more round than controls. Significance was determined by unpaired, 1-tailed Student’s t test (E) or 1-way ANOVA (F and G). n ≥ 10 imaging fields per treatment. ****(P < 0.0001). Error bars, SEM.