
- Title
-
Latent TGFβ binding proteins 1 and 3 protect the larval zebrafish outflow tract from aneurysmal dilatation
- Authors
- Abrial, M., Basu, S., Huang, M., Butty, V., Schwertner, A., Jeffrey, S., Jordan, D., Burns, C.E., Burns, C.G.
- Source
- Full text @ Dis. Model. Mech.
|
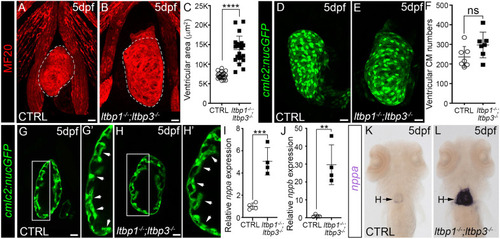
ltbp1, ltbp3 DKO larvae develop ventricular dilation with molecular features of a stress response. (A,B) Confocal images of hearts in 5 dpf control (CTRL; A) and ltbp1−/−; ltbp3−/− (B) larvae immunostained for striated muscle (MF20, red). Ventricular size was measured by quantifying the area within the perimeter of the chamber (areas encircled by dashed lines). (C) Dot plot showing the ventricular areas of 5 dpf CTRL (n=22) and ltbp1−/−; ltbp3−/− (n=21) larvae. (D,E) Confocal images of hearts in 5 dpf CTRL (D) and ltbp1−/−; ltbp3−/− (E) larvae carrying the cmlc2:nucGFP transgene and immunostained for GFP. (F) Dot plot showing the number of ventricular cardiomyocytes in 5 dpf CTRL (n=7) and ltbp1−/−; ltbp3−/− (n=7) larvae. (G-H′) Single optical sections of hearts in 5 dpf CTRL (G,G′) and ltbp1−/−; ltbp3−/− (H,H′) larvae carrying the cmlc2:nucGFP transgene and immunostained for GFP. The boxed regions in G and H are shown enlarged in G′ and H′, respectively. Arrowheads highlight trabeculae, observed in seven out of seven ventricles for both experimental groups. (I,J) Dot plots showing the relative expression levels of nppa (I) and nppb (J) in 5 dpf CTRL and ltbp1−/−; ltbp3−/− larvae measured by qPCR. n=4 biological replicates and n=3 technical replicates per biological replicate. (K,L) Brightfield images of 5 dpf CTRL (K) and ltbp1−/−; ltbp3−/− (L) larvae processed for whole-mount in situ hybridization to detect nppa transcripts. Arrows in K and L highlight nppa expression in the heart. Little to no variation was observed between animals within each group (n>10/group). For all dot plots, statistical significance was determined with an unpaired t-test. Error bars show one standard deviation. ****P<0.0001; ***P<0.001; **P<0.01; ns, not significant. Scale bars: 20 µm. |
|
EXPRESSION / LABELING:
PHENOTYPE:
|
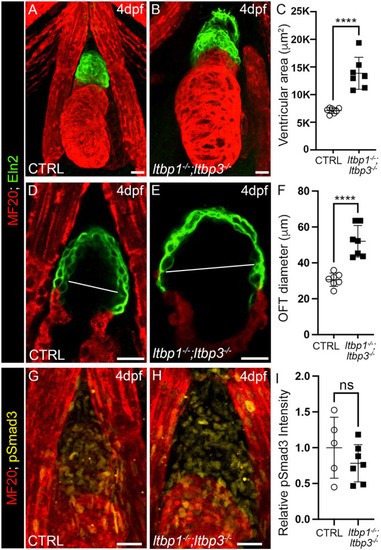
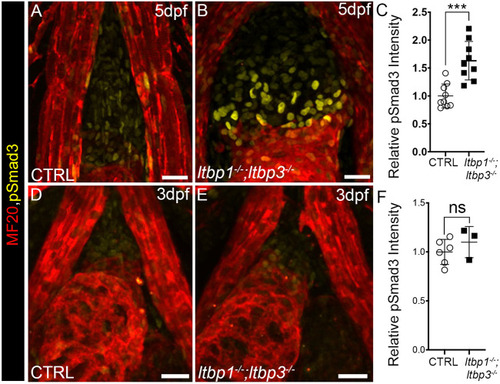
OFT aneurysm and ventricular dilation precede hyperactivation of TGFβ signaling in ltbp1, ltbp3 DKO larvae. (A,B) Confocal images of hearts in 4 dpf control (CTRL; A) and ltbp1−/−; ltbp3−/− (B) larvae double immunostained for striated muscle (MF20, red) and Eln2-positive OFT smooth muscle (green). (C) Dot plot showing the ventricular areas of 4 dpf CTRL (n=7) and ltbp1−/−; ltbp3−/− (n=7) larvae. (D,E) Single optical sections through the OFTs of 4 dpf CTRL (D) and ltbp1−/−; ltbp3−/− (E) larvae double immunostained for striated muscle (MF20, red) and Eln2-positive OFT smooth muscle (green). The white lines highlight the maximal OFT diameters between the walls of Eln2-positive smooth muscle. (F) Dot plot showing the maximal OFT diameters in 4 dpf CTRL (n=7) and ltbp1−/−; ltbp3−/− larvae (n=7). (G,H) Confocal images of OFTs in 4 dpf CTRL (G) and ltbp1−/−; ltbp3−/− (H) larvae double immunostained for striated muscle (MF20, red) and phosphorylated Smad3 (pSmad3, green). Dot plot showing the relative mean pSmad3 fluorescence intensities in the OFTs of 4 dpf CTRL (n=5) and ltbp1−/−; ltbp3−/− (n=7) larvae. For all dot plots, statistical significance was determined with an unpaired t-test. Error bars indicate one standard deviation. ****P<0.0001. ns, not significant. Scale bars: 20 µm. |
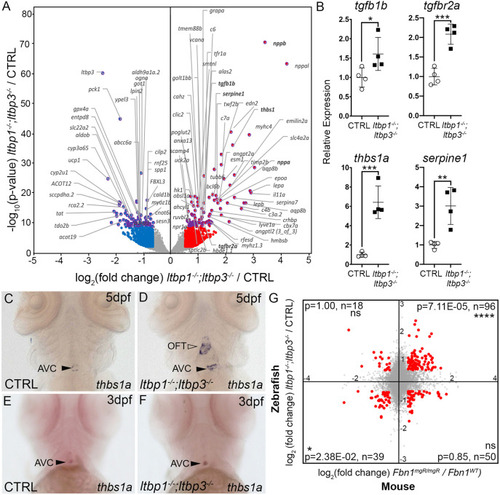
Molecular similarities between disease tissue from ltbp1, ltbp3 DKO larvae and ascending aortic aneurysms from a mouse model of Marfan syndrome. (A) Volcano plot showing the distribution of log2-fold changes and raw P-values for protein-coding RNAs isolated from co-dissected OFTs and ventricles of 5 dpf ltbp1−/−; ltbp3−/− larvae relative to control (CTRL) samples. Genes with raw P<10−10 are highlighted in purple and official gene symbols are provided. Genes meeting the inclusion criteria for GO term enrichment analysis – i.e. |log2-fold change|>0.58496, equivalent to |fold change|>1.5, and adjusted P<0.05 – are plotted in purple and red (upregulated) or blue (downregulated). Gene symbols in bold highlight transcriptional alterations consistent with hyperactivated TGFβ signaling or cardiac stress. (B) Dot plots showing the relative expression levels of tgfb1b, tgfbr2a, thbs1a and serpine1 transcripts in 5 dpf CTRL and ltbp1−/−; ltbp3−/− larvae as determined by qPCR. Statistical significance was determined with an unpaired t-test. n=4 biological replicates and n=3 technical replicates. Errors bars show one standard deviation. *P<0.05; **P<0.01; ***P<0.001. (C-F) Brightfield images of 5 dpf (C,D) and 3 dpf (E,F) CTRL (C,E) and ltbp1−/−; ltbp3−/− (D,F) larvae processed for whole-mount in situ hybridization to detect thbs1a transcripts. Closed and open arrowheads highlight the atrioventricular canal (AVC) and outflow tract (OFT), respectively. Little to no variation was observed between animals within each group (n>10/group). (G) Coordinate plane showing the log2-fold changes as in A plotted on the y-axis, and the log2-fold changes for orthologous mouse genes in aneurysm tissue from Fbn1mgR/mgR mice relative to control tissue plotted on the x-axis. Mouse data were sourced from Zilberberg et al. (2015). Orthologous gene pairs meeting the inclusion criteria for GO-term enrichment analysis – i.e. |log2-fold change|>0.37851, equivalent to |fold change|>1.3, and adjusted P<0.1 in both datasets – are highlighted in red. For each quadrant, the probability (p) that the indicated number of gene pairs (n) fulfills the inclusion criteria by chance was determined using a hypergeometric test. ns, not significant. ****P<0.0001, *P<0.05. EXPRESSION / LABELING:
PHENOTYPE:
|
|