
- Title
-
Inhibition of mTOR or MAPK ameliorates vmhcl/myh7 cardiomyopathy in zebrafish
- Authors
- Bu, H., Ding, Y., Li, J., Zhu, P., Shih, Y.H., Wang, M., Zhang, Y., Lin, X., Xu, X.
- Source
- Full text @ JCI Insight
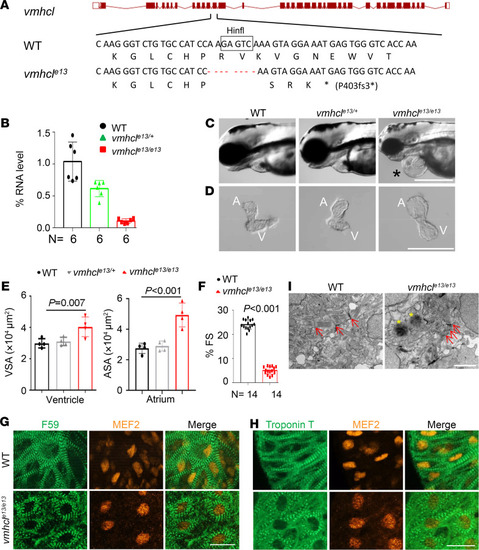
Depletion of vmhcl disrupts sarcomere integrity and results in a VEC model.
(A) Schematics of the vmhcl mutant allele generated using TALEN. The Hinfl restriction enzyme recognition site used for genotyping is boxed. Dashed lines indicate deleted nucleotides. The asterisk indicates an early translational stop codon. fs, frameshift. (B) Quantitative reverse transcription PCR (RT-PCR) revealed reduced expression of the transcript in both heterozygous (vmhcle13/+) and homozygous (vmhcle13/e13) mutants. (C–E) Representative images and quantification of the VSA and atrial surface area (ASA) in fish at 3 dpf. The asterisk indicates edema. A, atrium; V, ventricle; n = 4; 1 way ANOVA. (F) Percent FS of the vmhcle13/e13 mutant compared to WT control at 3 dpf. n = 14; data are presented as the mean ± SD. Paired 2-tailed Student’s t tests were used for statistical analyses. (G and H) The vmhcle13/e13 mutants exhibited disrupted sarcomere structure at 3 dpf. Fluorescence immunostaining using anti-myosin heavy chain 1 (F59) and anti-troponin T antibodies are shown. (I) Transmission electron microscope (TEM) images confirmed the disrupted sarcomere structure in the vmhcle13/e13 mutants. Arrows indicate sarcomeric Z-discs in the vmhcle13/e13 mutant compared to WT control. Asterisks point to degenerated sarcomere in the vmhcle13/e13 mutant. Scale bars: 500 μm in C, 200 μm in D, 10 μm in G and H, and 2 μm in I. EXPRESSION / LABELING:
PHENOTYPE:
|
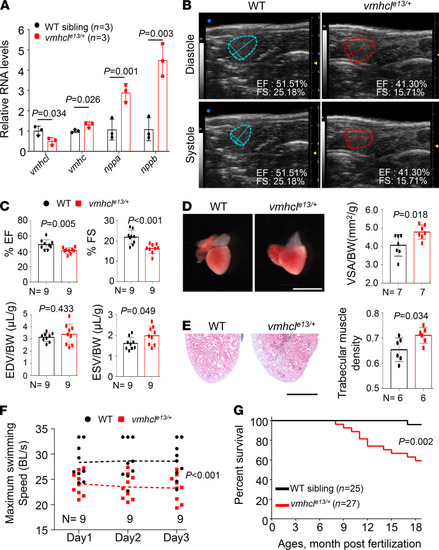
Haploinsufficiency of vmhcl results in CM in adult zebrafish.
(A) Quantitative RT-PCR analysis of CM molecular markers. n = 3 biological replicates; 2 tailed Student’s t test. (B) Representative echocardiography images of WT controls and vmhcle13/+ mutants at diastole and systole. (C) Quantification of cardiac function indices measured using echocardiography in the vmhcle13/+ mutant and WT control at 8 months. n = 9; data are presented as the mean ± SD; unpaired 2 tailed Student’s t test. (D) Representative images of isolated hearts and quantification of the VSA normalized to the BW of fish at 8 months. n = 7; unpaired 2 tailed Student’s t test. (E) Representative images of H&E staining in the apex area and quantification of trabecular muscle density in fish at 8 months. n = 6; unpaired 2 tailed Student’s t test. (F) Maximum swimming speed of fish at 8 months. n = 9; 2-way ANOVA. (G) Kaplan–Meier survival curves of vmhcl mutant fish and WT controls. n = 25–27; log-rank test; data are presented as the mean ± SD. Scale bars: 2 mm in D and 300 μm in E. |

A screen of compounds targeting 7 known CM pathways identified therapeutic compounds for VEC.
(A and B) Representative images and percentage of vmhcle13/e13 mutant fish with the indicated phenotypes after administration of the compounds or DMSO control at 5 dpf. Black stars indicate severe edema, and red stars indicate mild edema. It is anticipated that 25% of vmhcle13/+ incross offspring are homozygous vmhcle13/e13, which manifest severe pericardial edema (black stars). Administration of 5 different drugs reduced the percentage of vmhcle13/e13 mutants with edema to less than 20%; 3 of these drugs reduced the percentage with edema with statistical significance (P < 0.05). n = 84–122; χ2 test; scale bar: 500 μm. (C) Percent FS of the vmhcle13/e13 mutants after administration of the compounds compared to WT control at 5 dpf. n = 8; data are presented as the mean ± SD; 1-way ANOVA. PHENOTYPE:
|
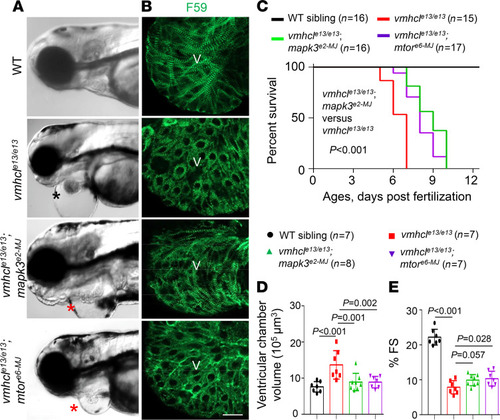
An F0 screen of 11 target genes in 7 known CM pathways identified mapk3 and mtor as 2 therapeutic modifier genes for VEC.
(A) Representative images of the heart area of F0 fish at 3 dpf. The black star indicates severe edema, and red stars indicate mild edema. Scale bar: 300 μm. (B) Fluorescence immunostaining images using anti-myosin heavy chain 1 (F59) in the ventricles of (from top to bottom): WT controls, vmhcle13/e13, vmhcle13/e13;mapk3e2-MJ, and vmhcle13/e13;mtore6-MJ mutant hearts at 3 dpf. Scale bar: 2 μm; V, ventricle. (C) Kaplan–Meier survival curves of vmhcle13/e13 mutant fish upon mapk3 and mtor inhibition and WT controls. n = 15–17; log-rank test. (D and E) VCV (D) and percent FS (E) of the vmhcle13/e13 mutants after mapk3 and mtor inhibition compared to WT controls at 3 dpf. n = 7–8; data are presented as the mean ± SD; 1-way ANOVA. EXPRESSION / LABELING:
PHENOTYPE:
|
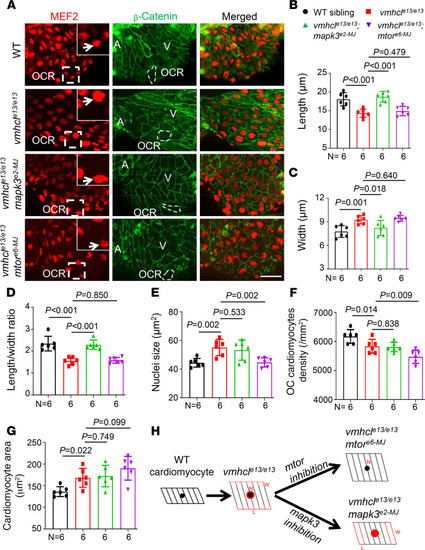
Distinct cellular effects of mtor and mapk3 inhibition on the VEC model.
(A) Representative images of the nucleus and outline of cardiomyocytes were obtained by immunostaining with anti–myocyte enhancer factor-2 (red) and anti–β-catenin (green) antibodies in WT controls and vmhcle13/e13, vmhcle13/e13mapk3e2-MJ, and vmhcle13/e13mtore6-MJ mutants at 3 dpf. The insets show the boxed areas at higher original magnification. The white arrows indicate nuclei of the cardiomyocytes. Representative cardiomyocytes in the OCR are outlined by dashed white lines in panels with β-catenin staining. A, atrium; V, ventricle; scale bar: 25 μm. (B–G) Quantification of the cardiomyocyte length (B), cardiomyocyte width (C), cardiomyocyte length/width ratio (D), cardiomyocyte nuclei size (E), cardiomyocyte density (F), and cardiomyocyte area (G) measured in these mutants and WT controls. n = 6; data are presented as the mean ± SD; 1-way ANOVA. (H) Schematics of different cellular changes observed upon mapk3 and mtor inhibition in the VEC model. Red indicates changes in cardiomyocyte length (L), width (W), or nuclei size (N). EXPRESSION / LABELING:
PHENOTYPE:
|

Therapeutic effects of mtor inhibition on the VAC model.
(A and B) Representative Western blots showing the levels of proteins involved in mTOR signaling pathways in WT controls, vmhcle13/+, and vmhcle13/+mtorxu015/+ mutants and quantification analysis. n = 3 biological replicates; data are presented as the mean ± SD; 1-way ANOVA. (C and D) Quantification of the percent EF and FS using echocardiography in fish at 8 months. n = 12; data are presented as the mean ± SD; 1-way ANOVA. (E and F) Representative images of isolated hearts and H&E staining in the apex area in fish at 8 months. (G and H) Quantification of the VSA normalized to BW and trabecular muscle density in these mutants and WT controls at 8 months. n = 6; data are presented as the mean ± SD; 1-way ANOVA. Scale bars: 2 mm in E and 300 μm in F. |