
Figure 4
- ID
- ZDB-FIG-220131-123
- Publication
- Bu et al., 2021 - Inhibition of mTOR or MAPK ameliorates vmhcl/myh7 cardiomyopathy in zebrafish
- Other Figures
- All Figure Page
- Back to All Figure Page
An F0 screen of 11 target genes in 7 known CM pathways identified mapk3 and mtor as 2 therapeutic modifier genes for VEC.
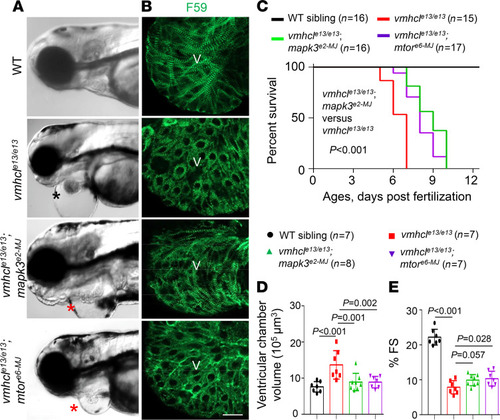
(A) Representative images of the heart area of F0 fish at 3 dpf. The black star indicates severe edema, and red stars indicate mild edema. Scale bar: 300 μm. (B) Fluorescence immunostaining images using anti-myosin heavy chain 1 (F59) in the ventricles of (from top to bottom): WT controls, vmhcle13/e13, vmhcle13/e13;mapk3e2-MJ, and vmhcle13/e13;mtore6-MJ mutant hearts at 3 dpf. Scale bar: 2 μm; V, ventricle. (C) Kaplan–Meier survival curves of vmhcle13/e13 mutant fish upon mapk3 and mtor inhibition and WT controls. n = 15–17; log-rank test. (D and E) VCV (D) and percent FS (E) of the vmhcle13/e13 mutants after mapk3 and mtor inhibition compared to WT controls at 3 dpf. n = 7–8; data are presented as the mean ± SD; 1-way ANOVA. |
| Antibody: | |
|---|---|
| Fish: | |
| Knockdown Reagents: | |
| Anatomical Term: | |
| Stage: | Protruding-mouth |
| Fish: | |
|---|---|
| Knockdown Reagents: | |
| Observed In: | |
| Stage Range: | Protruding-mouth to Days 7-13 |