
- Title
-
The Incoherent Fluctuation of Folate Pools and Differential Regulation of Folate Enzymes Prioritize Nucleotide Supply in the Zebrafish Model Displaying Folate Deficiency-Induced Microphthalmia and Visual Defects
- Authors
- Hsiao, T.H., Lee, G.H., Chang, Y.S., Chen, B.H., Fu, T.F.
- Source
- Full text @ Front Cell Dev Biol
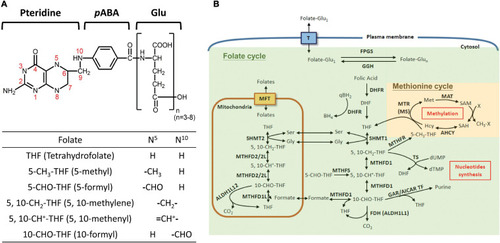
Folate-mediated one-carbon metabolism. |
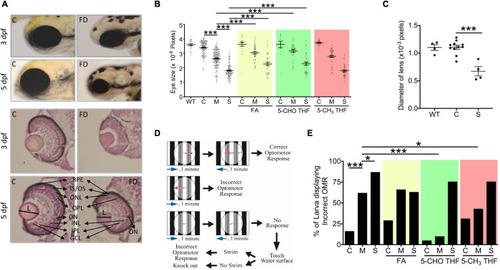
Morphological and functional characterization on the eyes of FD larvae. PHENOTYPE:
|

Developmental timing-specific analysis for the cell proliferation and cell cycle in developing larvae. The larvae of control and FD groups at 26, 48, and 72 hpf were subjected to immunostaining with anti-PH3 antibodies (M-phase marker) PHENOTYPE:
|
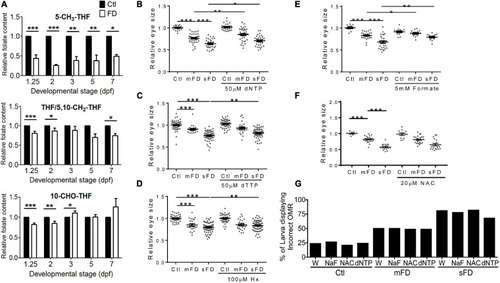
Larval folate composition and response to rescuing agents. Both control and FD embryos continuously exposed to rescuing agents starting from 25 hpf were examined for their intracellular folate composition PHENOTYPE:
|
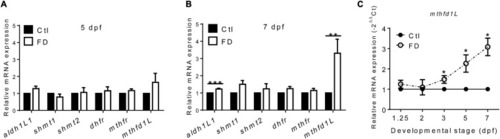
The mRNA levels of enzymes involved in FOCM in larvae. PHENOTYPE:
|
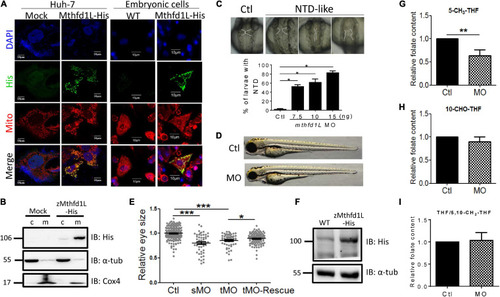
In vitro and in vivo characteristics of zebrafish mthfd1L. (A) The complete recombinant zebrafish Mthfd1L, encompassing the N-terminal signal peptide, was co-localized with mitochondria. Huh-7 cells transfected with zmthfd1L/pcDNA 3.1 myc-His (zMthfd1L) and pcDNA 3.1 myc-His (Mock) (left panel) and primary cultured zebrafish embryonic cells from embryos injected with mthfd1L cRNA (right panel) were stained with DAPI for nucleus, Mitotracker Deep Red 633 for mitochondria, and anti-His for zebrafish Mthfd1L. (B) The cytosolic and mitochondrial fractions of 293 cells transfected with zmthfd1L/pcDNA 3.1 myc-His and Mock analyzed with Western blotting confirmed the mitochondrial localization of zebrafish Mthfd1L. (C) The neural tube defect (NTD)-like phenotype was found in mthfd1L morphant (MO), but not in wild-type larvae (Ctl) at 3 dpf. (D,E) The eye size of mthfd1L morphants with (MO+cRNA)/without (MO) co-injecting synthesized mthfd1L capped-mRNA (cRNA) for rescue were examined and quantified at 3 dpf. Embryos were injected with translational MO (tMO) or splicing site MO (sMO) at 1–4-cell stage. (F) 1 dpf zebrafish embryos injected with mthfd1L cRNA were collected for embryonic lysates and subjected to Western blotting analysis. (G–I) Mthfd1L morphants at 3 dpf were analyzed with HPLC for folate composition. c, cytosolic fraction; m, mitochondrial fraction; α-tub, cytosolic marker; and Cox4, mitochondrial marker. MO, wild-type embryos injected with 10 ng mthfd1L MO; MO+cRNA, wild-type embryos co-injected with 10 ng mthfd1L MO and 1 ng mthfd1L synthesized RNA simultaneously. ***p < 0.001; **p < 0.01; *p < 0.05. PHENOTYPE:
|
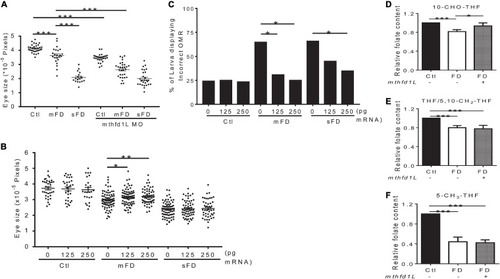
Effects of altering |
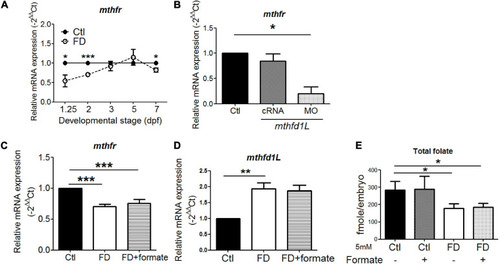
The interplay between Mthfr and Mthfd1L. |

Analysis of ocular cell differentiation in FD larvae and response to folate derivatives. EXPRESSION / LABELING:
PHENOTYPE:
|
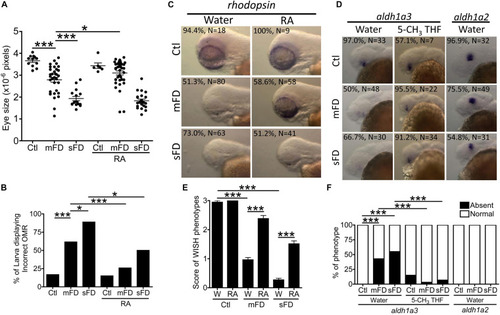
Ocular development in FD larvae and response to retinoic acid. Eye size (A) and OMR (B) of FD larvae with/without RA treatment were estimated at 5 and 7 dpf, respectively. The distributions of rhodopsin transcripts in larvae with/without RA supplementation were characterized with WISH at 3 dpf (C) and quantified (E). The distribution of aldh1a2 and aldh1a3 transcripts in larvae with/without RA supplementation were characterized with WISH at 30 hpf (D) and quantified (F). C, control; M, mFD; S, sFD. Statistical data are shown in mean ± SEM for (A,E) and percentage in a group for (B,F). ***p < 0.001; *p < 0.05. EXPRESSION / LABELING:
|
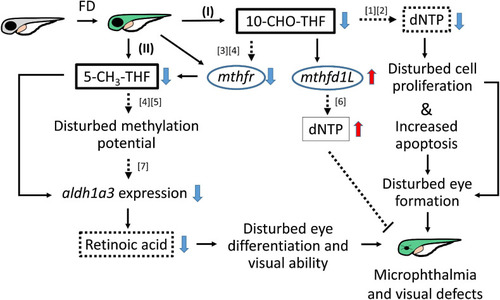
Proposed mechanism of FD-induced ocular defects. Solid lines indicate the experiments that were demonstrated in the current studies; dotted lines indicate the rationales supported by the listed references ([1] |