FIGURE SUMMARY
Title

Prmt5 promotes vascular morphogenesis independently of its methyltransferase activity

Authors
Quillien, A., Gilbert, G., Boulet, M., Ethuin, S., Waltzer, L., Vandel, L.
Source
Full text @ PLoS Genet.

Loss of <italic toggle='yes'>prmt5</italic> affect HSCs and HSPCs production.

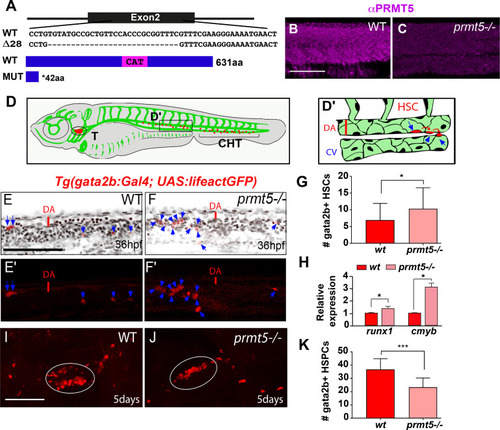
(A) Schematic representation of the sequence targeted by CRISPR/Cas9 leading to a 28 nucleotides deletion, and of wild type and truncated Prmt5 proteins. The catalytic domain “CAT” appears in magenta. (B, C) Confocal sections of immunostaining with anti-Prmt5 antibody of wild type and prmt5 mutant embryos at 24 hpf. Scale bar 100 μm. (D) Schematic representation of vascular (green) and hematopoietic (red) systems in a zebrafish larva. Circle and bracket indicate the Thymus (T) and the Caudal Hematopoietic Tissue (CHT), respectively. (D’) Close-up of the trunk vasculature where HSCs emerge from the ventral wall of the dorsal aorta (DA), bud and migrate. Red line represents the diameter of the dorsal aorta. Cardinal Vein (CV). (E-F’) Confocal projections of transgenic Tg(gata2b:Gal4; UAS:lifeactGFP) embryos at 36 hpf showing gata2b+ cells in red and TO-PRO-3 (cell nuclei) in black. Blue arrows indicate HSCs labelled in red in wild type (E, E’) and in prmt5 mutant (F, F’) embryos. Scale bar 100 μm. (G) Average number of HSCs enumerated per confocal stack in wild type and in prmt5 mutant embryos at 36 hpf. Data are from 3 independent experiments with at least 6 individuals per experiment and a Mann-Whitney test was performed. (H) Relative mRNA expressions determined by RT-qPCR in the trunk of 36 hpf wild type and prmt5 mutant embryos, from 3 independent experiments with at least 6 animals per condition. T-test was performed. (I, J) Confocal projections of wild type (I) and prmt5 mutant (J) thymus from transgenic Tg(gata2b:Gal4; UAS:lifeactGFP) embryos at 5 days. Thymus are delimited by a white circle. Scale bar 100 μm. (K) Average number of HSPCs enumerated per confocal stack in wild type and prmt5 mutant embryos at 5 days from 3 independent experiments with at least 5 individuals per analysis. T-test was performed. * P<0.05, ** P<0.01, ***P<0.001.

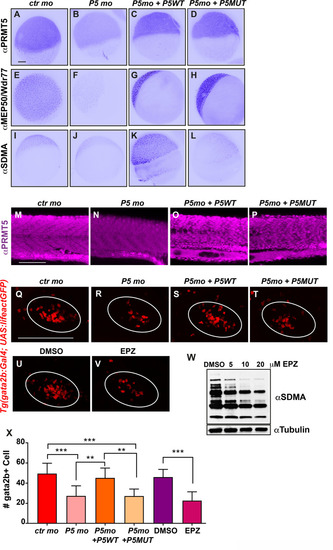
(A-D) PRMT5 immunostaining of 5 hpf embryos injected by control morpholino (A), or prmt5 morpholino only (B) or in combination with prmt5WT mRNA (C) or with the catalytic mutant form prmt5MUT mRNA (D). (E-H) Immunostaining of embryos as in A-D with an antibody raised against MEP50/Wdr77 PRMT5 obligate co-factor. (I-L) Immunostaining as in A-D but with an antibody recognizing SDMAs (symmetric Di-Methyl Arginine motifs) which are PRMT5 substrates. Scale bar, 100 μm. (M-P) Confocal projections of Prmt5 immunostaining of embryos injected by control morpholino (M), or prmt5 morpholino only (N) or in combination with prmt5WT mRNA (O) or with the catalytic mutant form prmt5MUT mRNA (P) at 24 hpf. Scale bar 100 μm. (Q-T) Confocal projections of thymus rudiment from transgenic Tg(gata2b:Gal4; UAS:lifeactGFP) embryos at 3 days in the same conditions as in M-P. Thymus is delimited by a white circle. (U-V) Confocal projections of thymus rudiment from transgenic Tg(gata2b:Gal4; UAS:lifeactGFP) embryos treated with either DMSO (U) or 20 μM of PRMT5 inhibitor EPZ015666 (V) from 30 hpf to 3 dpf. Thymus is delimited by a white circle. Scale bar 100 μm. (W) Western blot of protein extracts from 24 hpf embryos treated either with DMSO or with increasing concentrations (5–20 μM) of EPZ015666, revealed with an antibody recognizing SDMAs. Reblotting with α tubulin antibody served as a loading control. (X) Average number of HSPCs enumerated at 3 days per confocal stack in injected embryos as in Q-V. Data are from 2 independent experiments with at least 3 individuals per analysis. T-test was performed. **P<0.01. ***P<0.001.

Prmt5 requirement for vascular morphogenesis is independent of its methyltransferase activity.

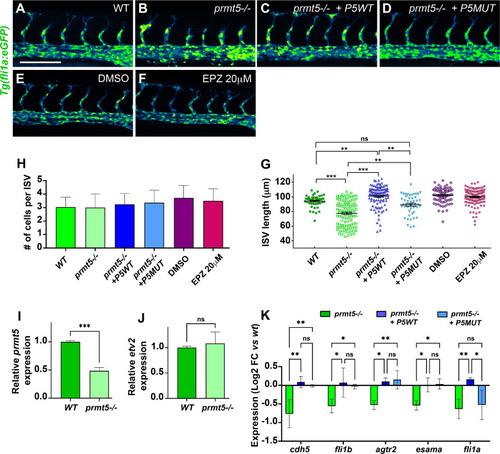
(A-D) Confocal projections of transgenic Tg(fli1a:GFP)y1 embryos at 28 hpf. Wild type embryo is on the top left panel (A), prmt5 mutant embryos were not injected (B) or injected with either prmt5WT mRNA (C) or the mutant form prmt5MUT mRNA (D). Scale bar 100 μm. (E, F) Confocal projections of transgenic Tg(fli1a:GFP)y1 embryos treated with either DMSO (E) or EPZ 20 μM (F) from 9 hpf to 28 hpf. (G, H) Average ISVs length in μm (G) and average number of endothelial cells per ISVs (H) of embryos. Data were from 3 independent experiments with at least 3 animals per condition. Kruskal-Wallis test (G) and One-way ANOVA (H) were performed. * P<0.05, ** P<0.01, *** P<0.001, **** P<0.0001. (I, J) Relative expression of prmt5 (I) or etv2 (J) mRNA by RT-qPCR on 28 hpf wild type and prmt5 mutant embryos from 3 independent experiments with at least 6 animals per condition. T-test was performed. ***P<0.001. (K) Log2 fold change expression relative to wt embryos of cdh5, fli1b, agtr2, esama and fli1a mRNAs by RT-qPCR on 28 hpf prmt5 mutant embryos not injected or injected by either prmt5WT or prmt5MUT mRNAs, from at least 2 independent experiments with a minimum of 6 animals per condition. Two-way ANOVA was performed. * P<0.05. **P<0.01.

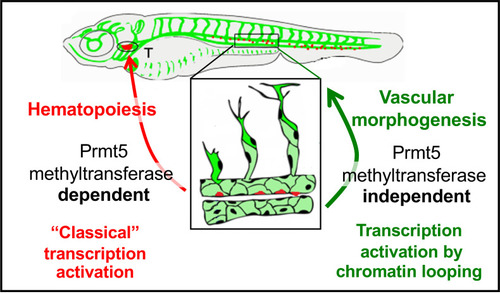
Schematic representation of the two distinct roles of Prmt5 during the formation of hematopoietic lineages and blood vessels, relying or not on its methyltransferase activity, respectively.

Loss of <italic toggle='yes'>prmt5</italic> impairs blood vessel formation.

(A) Schematic representation of the trunk vasculature with Intersegmental Vessels (ISV) sprouting from the dorsal aorta (DA). The tip cell leads the cell migration and the stalk cell maintains the connection with the DA. CV: cardinal vein. (B, C) Confocal projections of transgenic Tg(fli1a:GFP)y1 wild-type (B) and prmt5 mutant (C) embryos at 28 hpf. Red rectangles delimit where DA close ups were made. White rectangles delimit the higher magnification (x2) of the DA with red lines indicating the dorsal aorta diameters. White arrows indicate the connection point between two ISVs to form the Dorsal Longitudinal Anastomotic Vessel (DLAV). Scale bar 100 μm. (D, E) Average ISV length in μm (D) and average number of endothelial cells per intersegmental vessel (E) in control and in prmt5 mutant embryos from 3 independent experiments with at least 3 animals per condition. T-test and Mann Whitney test were performed, respectively. ** P<0.01, ***P<0.001. (F, G) Confocal projections of transgenic Tg(fli1a:GFP)y1 embryos injected by either control morpholino (F) or prmt5 morpholino (G) at 28 hpf. Scale bar 100 μm. (H, I) Average ISV length in μm (H) and average number of endothelial cells per ISV (I) in control and prmt5 morphant embryos, from 4 independent experiments with at least 5 animals per condition. Mann-Whitney test were performed. **** P<0.0001. (J, K) Confocal projections of control morphant (J) and prmt5 morphant (K) transgenic Tg(TP1bglob:VenusPEST)s940 embryos labelling cells of the DA at 28 hpf. Yellow lines delimit the measured area occupied by the DA. Scale bar 25 μm. (L) Average area occupied by the DA in μm2 in control and prmt5 morpholino injected embryos from 2 independent experiments with at least 8 animals per condition. T-test was performed. (M, N) Still images from movies of control (M) and prmt5 morphant (N) Tg(fli1a:GFP)y1 transgenic embryos from 28 to 38 hpf. Red asterisks label missing connections between tip and stalk cells as well as missing connections between tip cells that should lead to DLAV formation. Red arrows point to connecting ISVs leading to DLAV formation. White arrows indicate supernumerary sprouts. Yellow asterisks label the lumen of ISVs. Scale bar 50 μm.

Prmt5 promotes chromatin looping.

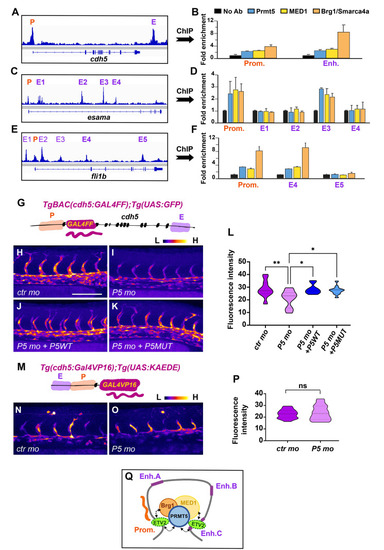
(A-F) ChIP experiments with the indicated antibodies on cdh5 (A, B), esama (C, D) and Fli1b (E, F) regulatory sequences. P, promoter; E, enhancer. Samples were analyzed in duplicates from 2 experiments. Fold enrichment was calculated relative to the input and to a negative region on the genome and then relative to the mock ChIP (No antibody). (G) Schematic representation of the transgene TgBAC(cdh5:GAL4FF) containing two putative cis-regulatory elements, a promoter region (P) and an enhancer (E), separated by ~20kb with the GAL4FF reporter gene inserted at the TSS of cdh5. (H-K) Confocal projections of transgenic TgBAC(cdh5:GAL4FF);Tg(UAS:GFP) embryos at 28 hpf. Control morphant is on the top left panel (H), prmt5 morphant embryos were not injected (I) or injected by either prmt5WT mRNA (J) or the catalytic mutant form prmt5MUT (K) mRNA. The fluorescent intensity is colored-coded, from the Low intensity (L) in black to High intensity (H) in white. Scale bar 100 μm. (L) Average GFP fluorescence intensity per confocal projection for control, prmt5 morphant embryos not injected or injected by prmt5WT mRNA or prmt5 MUT, from 3 independent experiments with at least 3 animals per condition. One-way ANOVA was performed. *P<0.05, **P<0.01. (M) Schematic representation of the transgene Tg(cdh5:GAL4VP16) containing the two putative cis-regulatory elements next to each other (E and P), upstream of GAL4VP16 reporter gene. (N, O) Confocal projection of transgenic Tg(cdh5:GAL4VP16);Tg(UAS:KAEDE) embryos at 26 hpf injected with either a control morpholino (N) or a prmt5 morpholino (O). The fluorescence intensity is color- coded, from the Low intensity (L) in black to High intensity (H) in white as in panels (H-F). (P)- Average KAEDE fluorescence intensity for control and for prmt5 morphant embryos, from 3 independent experiments with at least 5 animals per condition. T-test was performed. (Q) Proposed model to depict the function of Prmt5 in zebrafish endothelial cells. The transcription factor Etv2 bound on promoters and selective enhancers of endothelial specific genes, could recruit a complex including Prmt5, Brg1 and the mediator complex which favors the formation of a chromatin loop thereby facilitating the transcription of these genes. Dashed lines indicate potential interactions for the recruitments of Prmt5, Brg1 and/or the mediator complex by Etv2.

Acknowledgments
This image is the copyrighted work of the attributed author or publisher, and ZFIN has permission only to display this image to its users. Additional permissions should be obtained from the applicable author or publisher of the image. Full text @ PLoS Genet.