
- Title
-
Rcl1 depletion impairs 18S pre-rRNA processing at the A1-site and up-regulates a cohort of ribosome biogenesis genes in zebrafish
- Authors
- Zhu, Q., Tao, B., Chen, H., Shi, H., Huang, L., Chen, J., Hu, M., Lo, L.J., Peng, J.
- Source
- Full text @ Nucleic Acids Res.
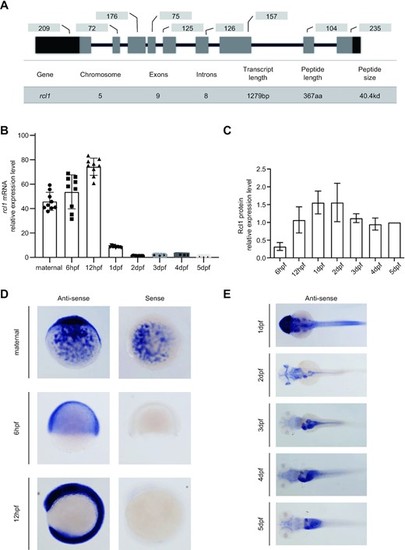
xpression of rcl1 is enriched in the digestive organs during organogenesis. (A) Upper panel: a schematic diagram showing the genomic structure of the zebrafish rcl1 gene on chromosome 5. Lower table: summarizing the genomic and transcript information for the rcl1 gene. Dark bar, exon, 5′- and 3′-untranslated region (UTR); gray bar, exon, protein coding region; dark line, introns. Numbers above each exon indicate the length (bp) of reach corresponding exon. (B) Real-time quantitative PCR (qPCR) analysis of rcl1 transcripts at different developmental stages. Total RNA was extracted from a clutch of 100–300 eggs/embryos for each time point. Three repeats, each with triplicate qPCR analysis, were performed. Relative expression level of rcl1 was presented after normalization against gapdh. (C) Statistical analysis of Rcl1 protein levels at different developmental stages from three western blots (Supplementary Figure S3C–E). Total proteins were extracted from a clutch of 100–200 embryos for each time point. The relative signal intensity of the Rcl1 protein band was presented after normalization against the Tubulin control for each time point. (D and E) Whole-mount in situ hybridization (WISH) analysis of the rcl1 expression patterns at different developmental stages using an anti-sense rcl1 probe. The rcl1 sense probe was used as a negative control (D). hpf, hours-post-fertilization; dpf, days-post-fertilization. |
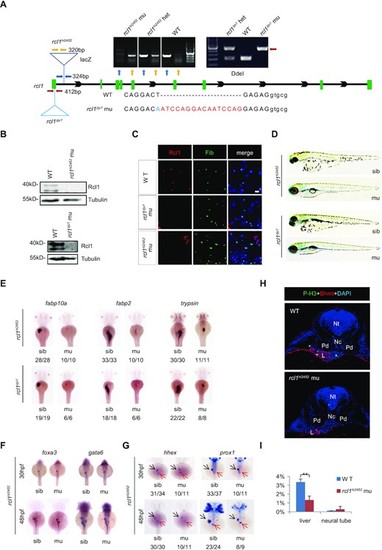
Depletion of Rcl1 causes hypoplastic digestive organs. (A) Schematic drawing shows the genomic DNA structure of the rcl1 gene and relative positions of the rcl1hi2452 (the viral vector insertion in intron 1) and rcl1zju1 (16bp insertion in the exon1) mutation sites. Primer pairs used for genotyping the two mutant alleles are indicated by different color arrowheads, and a gel photo of their corresponding PCR products is shown above the drawing. Yellow arrowheads, primer pair for checking the viral insertion in heterozygous (+/−) or homozygous (−/−) mutants; blue arrowheads, for checking the wild-type gene in wild-type sibling (+/+) or heterozygous mutant (+/−); red arrowheads, for genotyping the rcl1zju1 mutant by checking the PCR product digested by Dde1 (WT but not the mutant PCR product can be cleaved by Dde1). Lower panel: showing the DNA sequence changes in rcl1zju1 mutant (red letters, insertion; blue letters, substitution; capital letters, exon; small letters: intron). (B) Western blot of Rcl1 protein in embryos at 5dpf. Upper panels: WT and rcl1hi245; lower panels: WT and rcl1zju1. (C) Immunostaining of Rcl1 and Fibrillarin (Fib) in the liver of WT, rcl1hi2452 and rcl1zju1 mutant at 5dpf. Nuclei are stained with DAPI; Scale bars: 50 μm. (D) Comparison of overall morphology between rcl1hi2452and rcl1zju1embryos with their corresponding sibling at 5dpf. (E–G) WISH using the fabp10a, fabp2 and trypsin probes on 3dpf-old rcl1hi2452 and rcl1zju1 intercross embryos (E). WISH using the foxa3 and gata6 probes (F) and hhex and prox1 (G) on rcl1hi2452 intercross embryos at 30hpf and 48hpf, respectively. Denominator vs numerator: number of embryos exhibiting the phenotype vs number of embryos of corresponding genotype examined. Black arrow, liver bud; red arrow, exocrine pancreas. (H) Immunostaining of P-H3 (green) and Bhmt (red) on cryosections obtained from 2.5dpf-old WT and rcl1hi2452 mutant embryos (H). Nuclei are stained with DAPI; Nt: neural tube; Nc: notochord; Pd: pronephric duct; L: liver. (I) Quantitative analysis of the P-H3 positive cells in the liver and neural tube in WT and rcl1zju1 mutants from three embryos, respectively. **P < 0.01. |
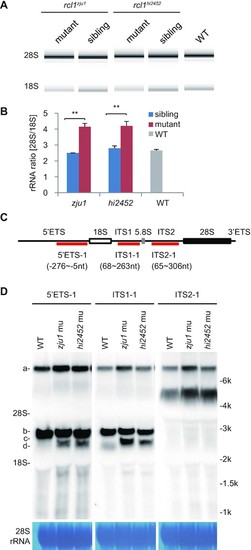
Depletion of Rcl1 impairs the maturation of 18S rRNA. (A) Analysis of total RNA from 5dpf-old rcl1hi2452 and rcl1zju1 mutants and their WT-phenotype siblings and also WT embryos by Agilent 2100 Bioanalyzer. (B) Statistic analysis of the ratios of mature 28S/18S rRNA in 5dpf-old rcl1hi2452 (hi2452) and rcl1zju1 (zju1) mutants and their WT-phenotype siblings (sibling) and also WT based on the data from Agilent 2100 Bioanalyzer. **P < 0.01. (C) Schematic drawing showing the structure of the zebrafish pre-rRNA and the relative positions of probes (5′ETS-1, ITS1-1, ITS2-1) designed for northern blot analysis of different pre-rRNA intermediates. The 18S, 5.8S and 28S mature rRNAs are indicated as white, gray and black boxes, respectively. (D) Northern blot analysis of pre-rRNA intermediates in 5dpf-old WT, rcl1hi2452 (hi2452) and rcl1zju1 (zju1) mutant embryos using the 5′ETS-1, ITS1-1 and ITS2-1 probes. Methylene blue staining of 28S rRNA: loading control. The pre-rRNA intermediates are highlighted to the left as a, b, c and d, respectively. To facilitate the comparison, same samples were reloaded three times on the same gel for electrophoresis. The filter was cut and subjected to the northern blot analysis using the 5′ETS-1, ITS1-1 and ITS2-1 probes, respectively. PHENOTYPE:
|
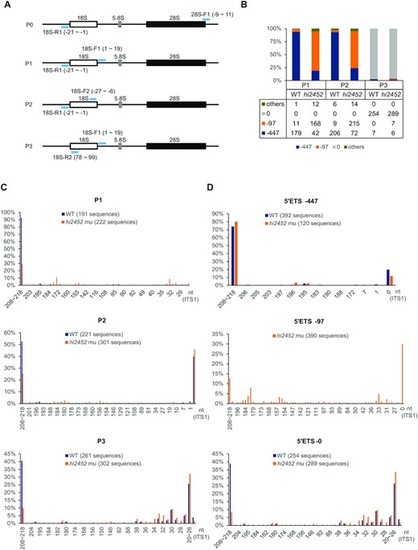
Depletion of Rcl1 compromised the cleavage of 18S pre-rRNA at the A1-site. (A) Schematic drawing showing the structure of the zebrafish pre-rRNA and the positions of four primer pairs (light blue bar) used in IPCR. P0: 18S-R1 (R1) and 28S-F1; P1: 18S-R1 and 18S-F1; P2: 18S-R1 and 18S-F2; P3: 18S-R2 and 18S-F1. (B) Histogram shows the ratios of -97nt, -447nt and other 5′ETS sequences based on sequencing the IPCR products obtained using the P1, P2 and P3 primer pairs, respectively. Table below the histogram shows the numbers of the sequenced single colonies (combined from three independent repeats) from WT and rcl1hi2452 for each primer pair. (C) Histogram comparing the patterns and ratios of ITS1 sequences between WT and rcl1hi2452 (hi2452) in the clones obtained by using P1, P2 and P3 primer pairs, respectively. (D) Histogram comparing the patterns and ratios of ITS1 sequences in the clones containing the –447nt 5′ETS (top panel) or without the 5′ETS sequence (5′ETS-0) (bottom panel) between WT and rcl1hi2452 (hi2452). Since there were very few (only 20 out of 673) WT clones containing the –97 5′ETS, in view of statistics, the analysis was only done for the rcl1hi2452 (hi2452) mutant (total 390 sequences available) (middle panel). In C and D, the number after WT and hi2452 represented the total number of sequences analyzed for each primer pair. PHENOTYPE:
|
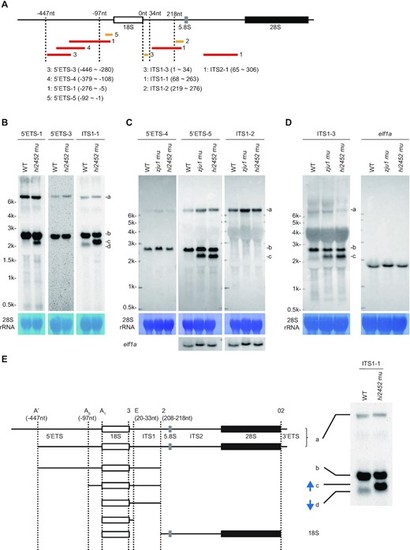
Defining major processing steps for 18S rRNA maturation in zebrafish. (A) Schematic drawing showing the positions of 8 probes used in northern blotting analysis of different pre-rRNA intermediates. The relative –447nt and -97nt positions in the 5′ETS, 34nt and 218nt positions in the ITS1 are indicated. Red bar: DIG labelled probes; yellow bar: biotin labelled probes. The correspondence between the number after the red or yellow bar and a specific probe is highlighted. (B–D) Northern blot analysis of pre-rRNA intermediates in WT and rcl1hi2452 (B) or in WT, rcl1hi2452 and rcl1zju1 (C and D) at 5dpf using corresponding probes as indicated. The pre-rRNA intermediates are marked to the right as a, b, c and d. Methylene blue staining of 28S rRNA: loading control; elf1a in (C): loading control; elf1a in (D): same samples loaded twice on the same gel for electrophoresis, then the filter was cut and subjected to northern blot analysis using ITS1-3 and elf1a probes, respectively. (E) Diagram illustrates the major processing steps for 18S rRNA maturation in zebrafish. Cleavage sites at A′ (-447nt 5′ETS), A0 (-97nt 5′ETS) and A1 (5′ETS-0) in 5′ETS, at 2 (208–218nt ITS1) and E (20–33nt ITS1) in ITS1 and at 02 in 3′ETS are indicated by vertical dotted lines. The pre-rRNA intermediates a, b, c and d correspond to that detected in northern blots as shown on the right (copied from Figure 5B, panel for the ITS1 probe). Blue arrow indicates the up-regulation of band c and down-regulation of band d in rcl1hi2452 and rcl1zju1 mutants as evident in Figures 3D and 5B-D. |
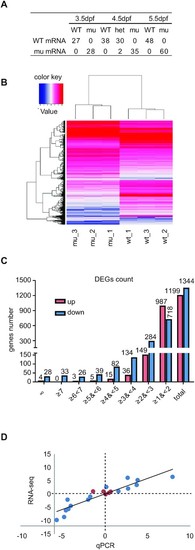
Depletion of Rcl1 causes down-regulation of 1344 genes and up-regulation of 1199 gene. (A) Sequencing analysis of WT rcl1 and mutant rcl1zju1 transcripts in the RT-PCR products obtained from WT, rcl1zju1/+ heterozygous and rcl1zju1 homozygous progenies of the rcl1zju1/+ intercross at 3.5dpf, 4.5dpf and 5.5dpf. (B) Hierarchical Clustering analysis of the RNA-seq data between WT and rcl1zju1 mutant with three biological repeats. (C) The log2 value distributions of the 1,199 significant up-regulated and 1,344 down-regulated genes (cut-off value: log2≧|±1|, P <0.05) in rcl1zju1 mutant at 4.5dpf. (D) Confirmation of the RNA-seq data by the qPCR analysis of 20 randomly selected genes in WT and rcl1zju1 mutant. Expression data of genes detected by RNA-seq was plotted against those by qPCR. The reference line indicates the linear correlation between the RNA-seq and qPCR. Blue dot: gene with significant change in RNA-seq; red dot: gene without significant change. |

GO and KEGG enrichment analysis of the DEGs reveled an up-regulation of a cohort of genes related to ribosome biogenesis. (A) Top 10 significantly enrichment GO analysis for up-regulated (right panel, red bar) and down-regulate (left panel, blue bar) DEGs in BP, MF and CC items. BP: biological process (pink panel, top); MF: molecular function (light blue panel, middle); CC: cellular component (yellow panel, bottom). (B) Significantly enriched KEGG pathway for up-regulated (right panel, red bar) and down-regulate (left panel, blue bar) DEGs. |