
- Title
-
Luspatercept restores SDF-1-mediated hematopoietic support by MDS-derived mesenchymal stromal cells
- Authors
- Wobus, M., Mies, A., Asokan, N., Oelschlägel, U., Möbus, K., Winter, S., Cross, M., Weidner, H., Rauner, M., Hofbauer, L.C., Bornhäuser, M., Platzbecker, U.
- Source
- Full text @ Leukemia
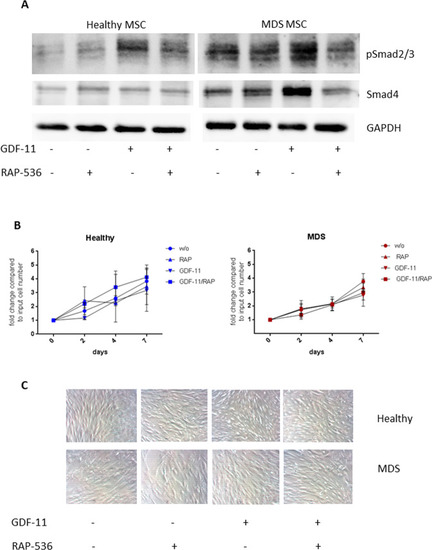
A Western blot analysis of phospho Smad2/3 (52 kDa) and Smad4 (60 kDa) in healthy and MDS MSCs following 0.1 µg/ml GDF-11/ 10 µg/ml RAP-536 treatment. GAPDH (37 kDa) served as reference protein. B Cell counts of untreated (w/o) or GDF-11/RAP-536-treated healthy and MDS MSCs were determined by trypan blue staining after 2, 4, and 7 days. Values represent mean ± SD in triplicate for N = 3 healthy and N = 5 MDS MSC cell counts normalized to the starting cell number. C Representative light microscopy images showing the morphology of healthy (upper panel) and MDS (lower panel) MSCs at indicated treatment conditions at day 7 (magnification 20×). |
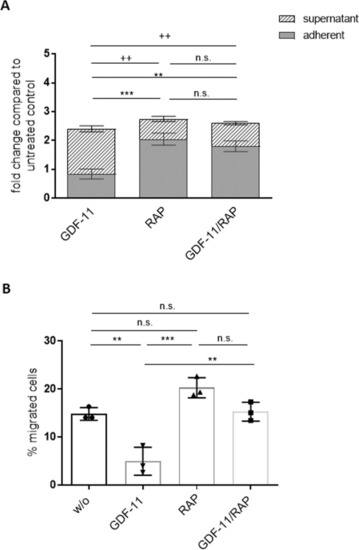
A After 1 week of co-culturing HSPCs derived from healthy donors on GDF-11/RAP-536 pre-treated MDS MSC layers, the fold change of CD45+ cell numbers compared to the untreated control layers was determined in the supernatant and the adherent fraction under the indicated treatment conditions. Error bars represent mean ± SD of the adherent fraction, ns p > 0.05, **p < 0.01, ***p < 0.001, and the supernatant fraction, ns p > 0.05, ++p < 0.01, N = 5, analyzed by two-way ANOVA with Tukey’s multiple comparisons test. B The migratory capacity of co-culture-derived HSPCs was analyzed in a Boyden chamber trans-well system. Error bars represent mean ± SD. ns p > 0.05, **p < 0.01, ***p < 0.001, N = 3 different co-culture experiments. Significance was assessed by one-way ANOVA with Tukey’s multiple comparisons test. |
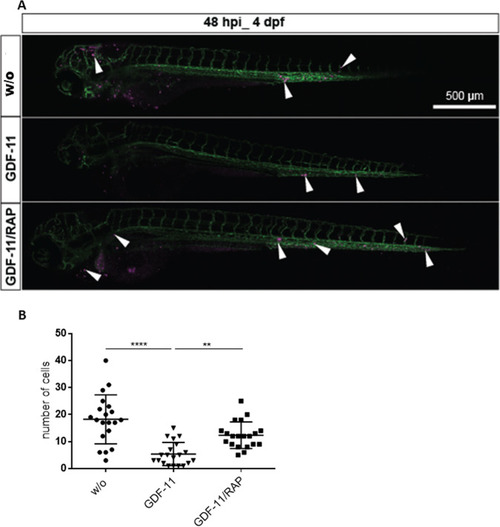
A Representative images of zebrafish larvae at 48 hpi. Addition of RAP-536 to GDF-11 pre-treatment of co-cultured MSCs rescued the survival and homing of HSPCs in the CHT region. Surviving HSPCs (magenta) are indicated by white arrowheads, the vasculature is labeled in green. Scale bar 500 µm. B Quantification of HSPCs in the tail region at 48 hpi. One representative experiment is shown, N = 20 embryos in each group, **p < 0.01, ****p < 0.0001. Significance was assessed with Kruskal–Wallis test followed by Dunn’s multiple comparisons post-hoc test. |
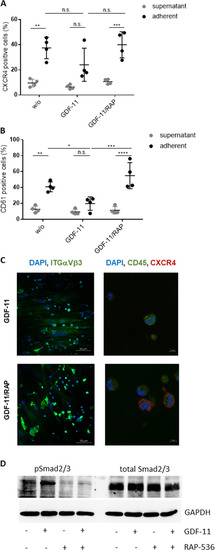
HSPCs cultured for 1 week on GDF-11/RAP-536 pre-treated MDS MSC layers were evaluated by flow cytometry for the expression of A CXCR4 and B CD61. Cumulative data from four experiments are shown as mean ± SD. ns, p > 0.05, *p < 0.05, **p < 0.01, ***p < 0.001, ****p < 0.0001. Significance was assessed by two-way ANOVA with Sidak’s and Tukey’s multiple comparisons test. C Representative confocal microscopy images of ITGαVβ3 (green) and CXCR4 (red)/CD45 (green) with nuclear DAPI staining of HSPCs adherent on GDF-11 or GDF-11/RAP-536 pre-treated MDS MSC layers. D Western blot analysis of phospho Smad2/3 (52 kDa) and total Smad2/3 protein (52 kDa) in GDF-11/RAP-536 pre-treated MSCs after co-culture with HSPCs. Duplicate sample aliquots were run on a single gel, which was blotted before being cut into two halves: one being used for phosphor Smad2/3 and one for total Smad2/3 detection. GAPDH (37 kDa) served as reference protein. One representative experiment is shown, N = 3. |
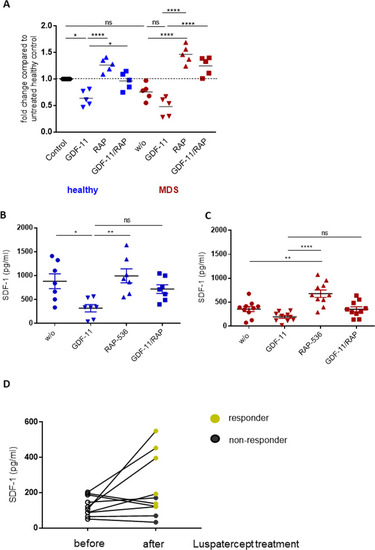
A mRNA quantification of healthy and MDS MSCs by real-time PCR. Relative target quantity was determined using the comparative CT (∆∆CT) method. Amplicons for SDF-1 were normalized to endogenous GAPDH expression and the untreated healthy MSCs were set to 1 (=control). Cumulative data from five donors are shown as mean ± SD. Significance was assessed by one-way ANOVA with Tukey’s multiple comparisons test. ns, p > 0.05, *p < 0.05, ****p < 0.0001. B, C SDF-1 protein levels in the MSC culture supernatant were analyzed by ELISA. Cumulative data from seven healthy donors and ten MDS patients are shown as mean ± SD. Significance was assessed by one-way ANOVA with Tukey’s multiple comparisons test. ns, p > 0.05, *p < 0.05, **p < 0.01, ****p < 0.0001. D SDF-1 levels were determined in bone marrow plasma of patients before and after treatment with luspatercept (N = 10). Black symbols indicate patients who did not respond to the treatment, green symbols the responders. |
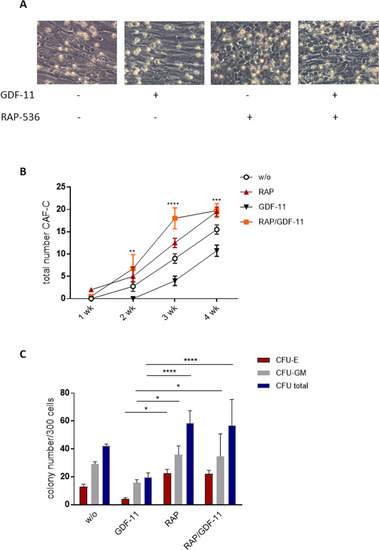
MDS MSCs were pre-treated with 0.1 µg/ml GDF-11 and/or 10 µg/ml RAP-536 for 7 days and co-cultured with freshly isolated CD34 + HSPC. A Representative images of CAF-C for each condition. B Quantification of CAF-C after 1, 2, 3, and 4 weeks. Pooled data from N = 3 MDS MSC/HSPC co-culture experiments are shown as mean ± SD, **p < 0.01, ***p < 0.001, ****p < 0.0001 for GDF-11 vs. RAP/GDF-11. C After 1 week of co-culture, a CFU assay was performed for 14 days in methylcellulose medium and the colonies were classified under the microscope or by using the StemVision system. Cumulative data from four experiments are shown as mean ± SD, *p < 0.05, ****p < 0.0001 by two-way ANOVA with Tukey’s multiple comparisons test. |
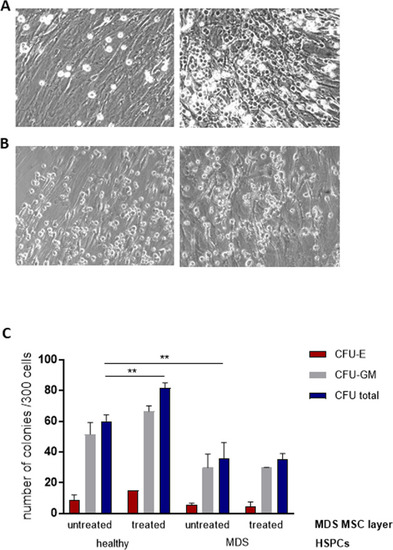
Representative images of co-cultures of MDS MSCs before (left) and after luspatercept treatment (right) with HSPCs from healthy donors (A) or the same MDS patient (B) at day 7. C After 1 week of co-culture, a CFU assay was performed for 14 days in methylcellulose medium and the colonies were classified using the StemVision system. Data are shown from one experiment in duplicate as mean ± SD, **p < 0.01 by two-way ANOVA with Tukey’s multiple comparisons test. |
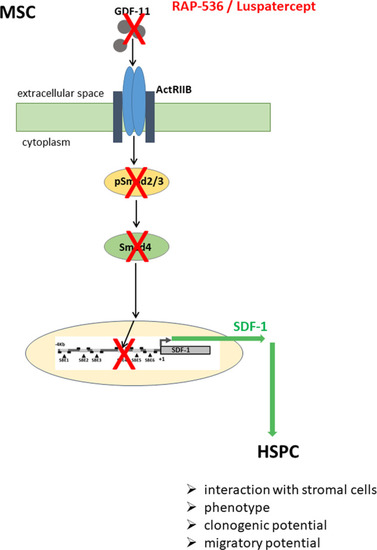
High GDF-11 levels in the MDS BMME activate Smad2/3 phosphorylation and expression of Co-Smad4 that binds to the SDF-1 promoter region [7] thereby suppressing transcription and leading to impaired hematopoiesis. Trapping GDF-11 by RAP-536/luspatercept reduces Smad2/3 and Smad4 activity resulting in SDF-1 promoter activation and elevated expression, thereby restoring HSPC support. |