
|
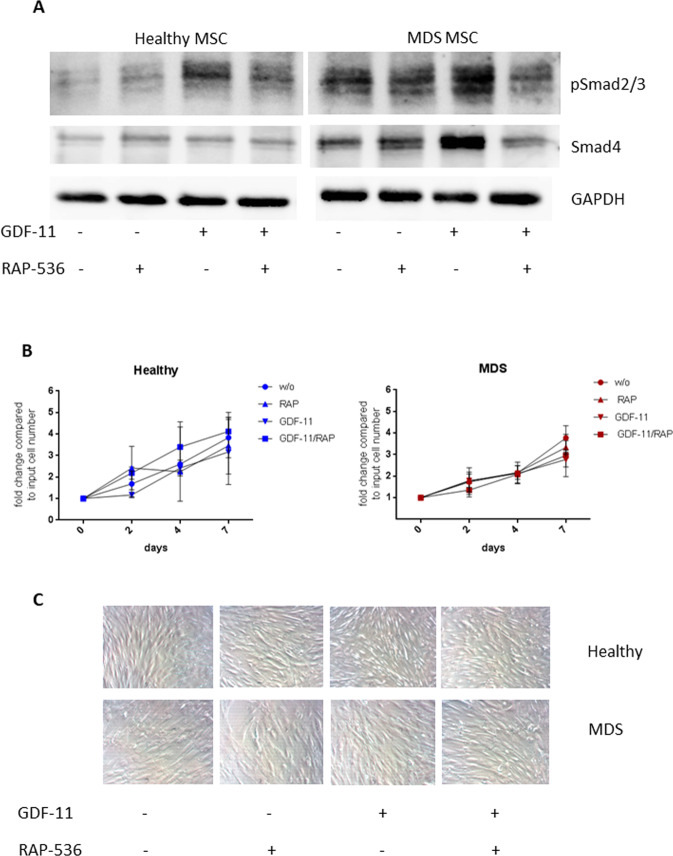
Fig. 1 A Western blot analysis of phospho Smad2/3 (52 kDa) and Smad4 (60 kDa) in healthy and MDS MSCs following 0.1 µg/ml GDF-11/ 10 µg/ml RAP-536 treatment. GAPDH (37 kDa) served as reference protein. B Cell counts of untreated (w/o) or GDF-11/RAP-536-treated healthy and MDS MSCs were determined by trypan blue staining after 2, 4, and 7 days. Values represent mean ± SD in triplicate for N = 3 healthy and N = 5 MDS MSC cell counts normalized to the starting cell number. C Representative light microscopy images showing the morphology of healthy (upper panel) and MDS (lower panel) MSCs at indicated treatment conditions at day 7 (magnification 20×).