
|
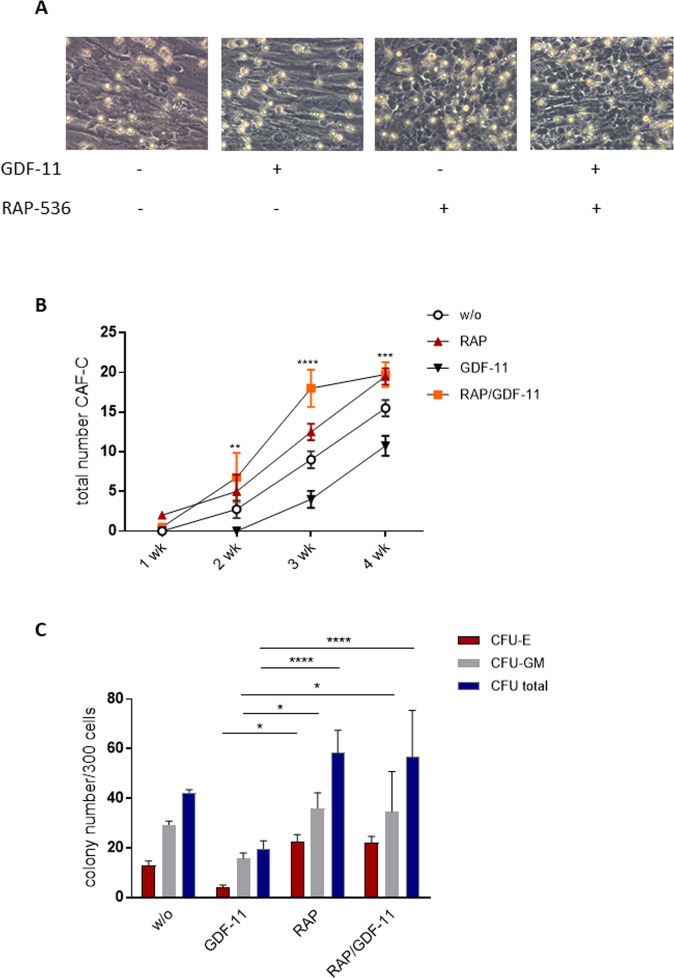
Fig. 6 MDS MSCs were pre-treated with 0.1 µg/ml GDF-11 and/or 10 µg/ml RAP-536 for 7 days and co-cultured with freshly isolated CD34 + HSPC. A Representative images of CAF-C for each condition. B Quantification of CAF-C after 1, 2, 3, and 4 weeks. Pooled data from N = 3 MDS MSC/HSPC co-culture experiments are shown as mean ± SD, **p < 0.01, ***p < 0.001, ****p < 0.0001 for GDF-11 vs. RAP/GDF-11. C After 1 week of co-culture, a CFU assay was performed for 14 days in methylcellulose medium and the colonies were classified under the microscope or by using the StemVision system. Cumulative data from four experiments are shown as mean ± SD, *p < 0.05, ****p < 0.0001 by two-way ANOVA with Tukey’s multiple comparisons test.