
Image
|
Figure Caption
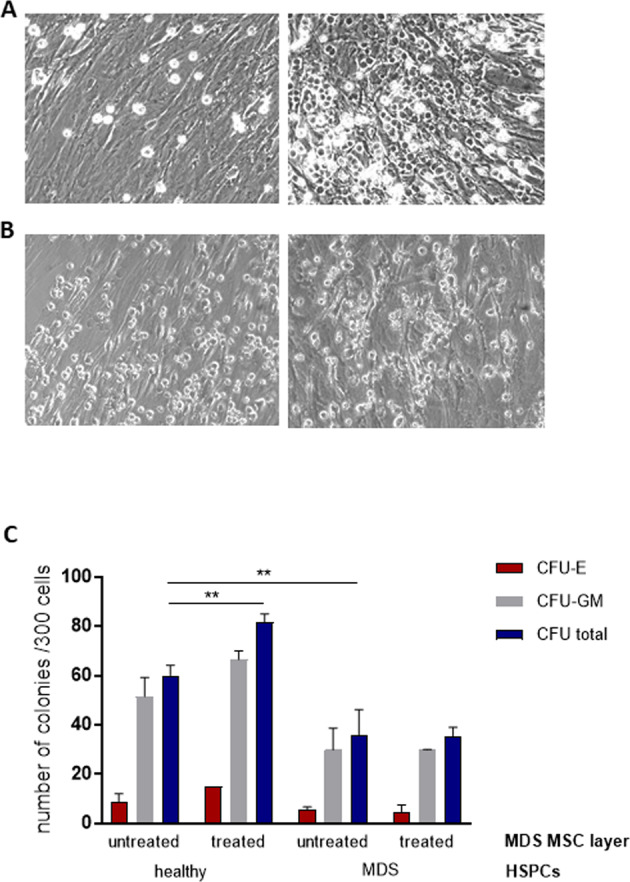
Fig. 7 Representative images of co-cultures of MDS MSCs before (left) and after luspatercept treatment (right) with HSPCs from healthy donors (A) or the same MDS patient (B) at day 7. C After 1 week of co-culture, a CFU assay was performed for 14 days in methylcellulose medium and the colonies were classified using the StemVision system. Data are shown from one experiment in duplicate as mean ± SD, **p < 0.01 by two-way ANOVA with Tukey’s multiple comparisons test.
Acknowledgments
This image is the copyrighted work of the attributed author or publisher, and
ZFIN has permission only to display this image to its users.
Additional permissions should be obtained from the applicable author or publisher of the image.
Full text @ Leukemia