
|
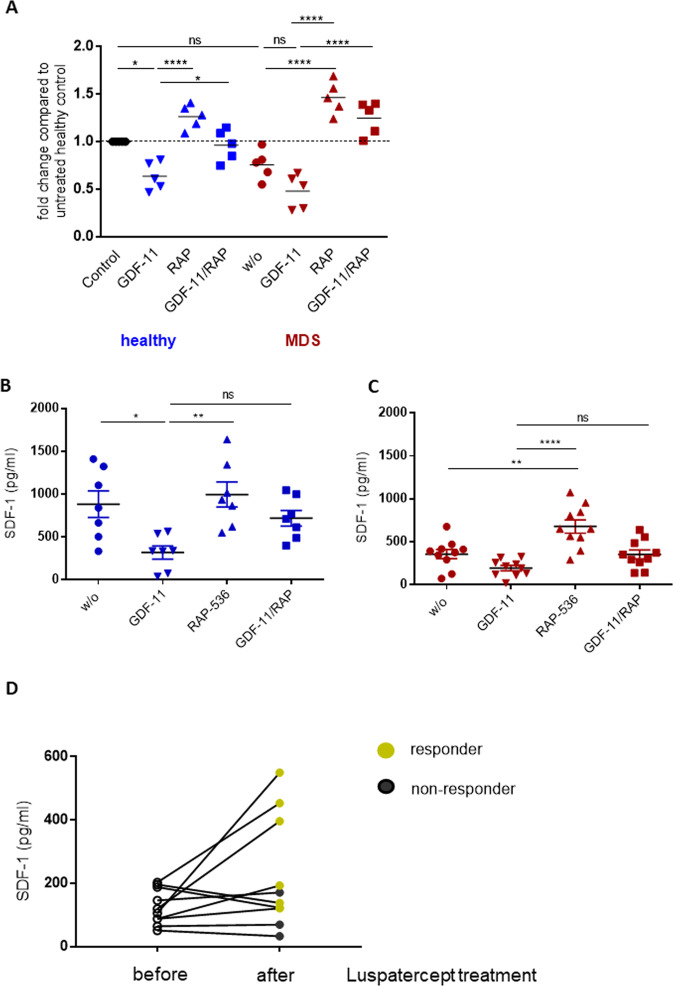
Fig. 5 A mRNA quantification of healthy and MDS MSCs by real-time PCR. Relative target quantity was determined using the comparative CT (∆∆CT) method. Amplicons for SDF-1 were normalized to endogenous GAPDH expression and the untreated healthy MSCs were set to 1 (=control). Cumulative data from five donors are shown as mean ± SD. Significance was assessed by one-way ANOVA with Tukey’s multiple comparisons test. ns, p > 0.05, *p < 0.05, ****p < 0.0001. B, C SDF-1 protein levels in the MSC culture supernatant were analyzed by ELISA. Cumulative data from seven healthy donors and ten MDS patients are shown as mean ± SD. Significance was assessed by one-way ANOVA with Tukey’s multiple comparisons test. ns, p > 0.05, *p < 0.05, **p < 0.01, ****p < 0.0001. D SDF-1 levels were determined in bone marrow plasma of patients before and after treatment with luspatercept (N = 10). Black symbols indicate patients who did not respond to the treatment, green symbols the responders.