
- Title
-
Immunoglobulin superfamily receptor junctional adhesion molecule 3 (Jam3) requirement for melanophore survival and patterning during formation of zebrafish stripes
- Authors
- Eom, D.S., Patterson, L.B., Bostic, R.R., Parichy, D.M.
- Source
- Full text @ Dev. Biol.
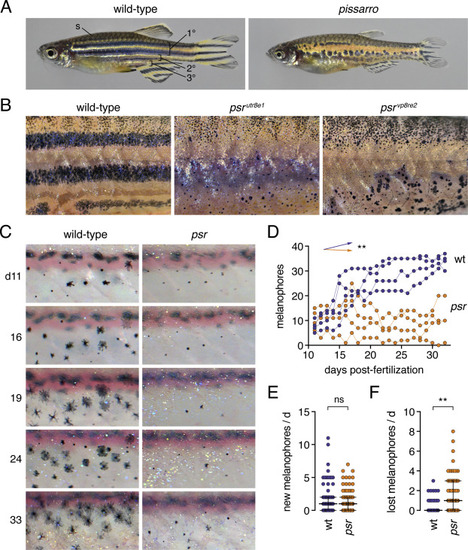
Phenotypes and pattern ontogeny of wild-type and pissarro (psr) mutant zebrafish. (A) Wild-type adult fish with primary, secondary and tertiary pattern elements and scale (s) melanophores labeled. psr mutants (here psrvp8re2) have disrupted melanophore stripes and fins that are short relative to body size. (B) Higher magnification images illustrating disorganized melanophores and iridophores in wild-type fish or homozygous mutants for different psr alleles. In psrvpr8e2 some melanophores were apparent on ventral scales (arrowhead), typical of the wik genetic background in which the allele was maintained. Insets illustrate well-spread appearance of most stripe melanophores in wild-type and heterogeneity of melanophore morphologies in psr mutant alleles. (C) Repeated daily imaging of representative wild-type and psrutr8e1 mutant larvae through adult pigment pattern formation. Days at left indicate days post-fertilization. Boxes indicate newly differentiating melanophores. Colored circles indicate melanophores lost from the pattern. These same fish are shown in Movies S1, S2. (D) Total numbers of melanophores increased in each of 4 repeatedly imaged wild-type larvae but remained at initial levels or decreased in each of 4 psr mutants in ventral portions of 3 segments. Differences in melanophore numbers were reflected in a significant genotype × day interaction after controlling for variation among individuals (∗∗, F1,6 = 23.7, P = 0.0028; arrows indicate slopes of partial regression coefficients). (E) Numbers of newly differentiating melanophores per day did not differ between wild-type and psr mutants after controlling for variation among individuals (ns, F1,6 = 0.3, P = 0.6099). (F) Melanophores were, however, significantly more likely to be lost from psr mutants than wild-type after controlling for variation among individual fish (∗∗, F1,6.2 = 16.5, P = 0.0063; counts of melanophores were square root-transformed for analysis to correct for heterogeneity in residual variance between genotypes). Bars in E and F are medians ± interquartile range. |
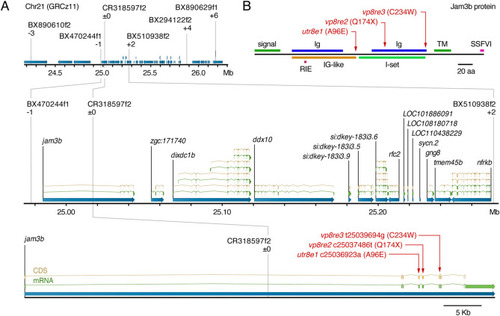
Positional cloning of psr. (A) Region of Chr21 to which psr was mapped using polymorphisms identified in ABwp and wik backgrounds. Informative markers and recombinants relative to psrutr8e1 phenotype are shown above chromosome. Positions of causal substitutions below, relative to zebrafish whole genome assembly GRCz11 (nucleotides) or Jam3b protein (amino acids). (B) Amino acid substitutions in psr mutant alleles relative to Jam3b protein domains. RIE, homophilic interaction domain tripeptide; TM, transmembrane domain; SSFVI, type II PDZ-domain-binding motif (Ebnet, 2017; Ebnet et al., 2004; Kostrewa et al., 2001; Powell and Wright, 2012; Santoso et al., 2005). |

jam3b expression in pigment cells and other cell types of post-embryonic zebrafish. (A) RT-PCR for jam3b and related 2-Ig domain receptor gene igsf11 in isolated melanophores (mel), xanthophores (xan), iridophores (irid), and whole fin tissue. –, no template control. pmela marks melanophores, colony stimulating factor 1 receptor a (csf1ra) marks xanthophores, and purine nucleoside phosphorylase 4a (pnp4a) most strongly marks iridophores and melanophores (Lang et al., 2009; Patterson and Parichy, 2013; Saunders et al., 2019). (B) jam3b and jam2a expression in melanophores, xanthophores, iridophores, and post-embryonic pigment progenitor cells (N = 3954 cells total) by single cell RNA-sequencing across states of maturation during adult pigment pattern formation. Cells in which transcripts were not detected (nd) are shown in light grey. Numbers show percentages of cells within each cluster in which each transcript was detected Sparsity of transcript detection may represent biological heterogenities or stochastic dropout associated with imperfect capture or other aspects of scRNA-Seq methodology, as is typical for genes expressed at moderate or low levels (Qiu, 2020). igsf11 transcripts were expressed at levels too low to detect by scRNA-Seq (Eom et al., 2012). (C–E) Expression of jam3b:Jam3b-mCherry. (C) Upper, Segmental expression (arrowheads) associated with vasculature (arrowheads) in a late larva (10 SSL). Diffuse expression is also evident in fin (f). ∗, highly reflective melanoleucophores (Lewis et al., 2019) of the dorsal fin, not representative of Jam3b-mCherry expression. Lower left, Expression in an earlier larva (6 SSL), with labeling of vasculature (v) as well as myocytes (myo). Arrow, early larval melanophore at horizontal myoseptum. Lower right, Jam3b-mCherry co-expression with endothelial marker kdrl:GFP (lower right). Additional Jam3b-mCherry was evident in presumptive Schwann cells of an adjacent nerve fiber (n) (Ebnet, 2017; Scheiermann et al., 2007). (D) Within mature stripes, Jam3b-mCherry accumulated at sites of apparent overlap between melanophores but typically did not extend to where melanophore membranes bordered the interstripe (arrowheads). Different regions are shown of the same fish (14 SSL) after partial contraction of melanin granules with epinephrine, using widefield epifluorescence to capture tissue context. (E) Low and high magnification images of interstripe iridophores (7 and 6 SSL, respectively), in which Jam3b-mCherry accumulated at sites of juxtaposition between cells (arrows). Yellow dots outline individual iridophores for clarity at right. Scale bars, 500 μM, 50 μM, 20 μm (C), 50 μM (D), 20 μm (E). EXPRESSION / LABELING:
|
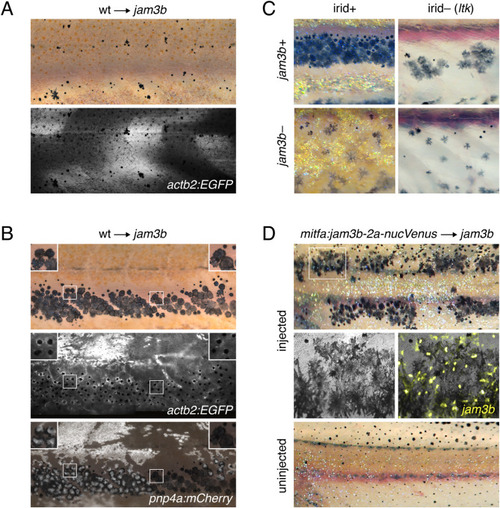
Cell-autonomy of melanophore requirement for Jam3b. (A) Fluorescently labeled wild-type cells that developed as myotome (shown here) or epidermis did not rescue the pigment pattern of jam3b mutant hosts (n = 4 individuals developed these cell types of 11 informative chimeras). (B) Wild-type cells that developed as melanophores in psr mutant hosts exhibited wild-type morphologies and arrangements, whether or not these cells developed in the vicinity of wild-type iridophores (left and right details, respectively). Transplanted cells in these experiments were transgenic for actb2:EGFP, which is broadly expressed across a variety of cell types, but variegated in iridophores, and pnp4a:mem-mCherry, which is expressed reliably in iridophores (Patterson and Parichy, 2013; Spiewak et al., 2018). Images are stitched from multiple tiles and melanosomes were contracted partially towards cell centers by epinephrine treatment to facilitate detection of actb2:EGFP (n = 10 individuals developed these cell types). (C) In ltk mutant fish, iridophores are absent and fewer melanophores develop, resulting in spots rather than stripes (upper right) (Frohnhofer et al., 2013; Lopes et al., 2008; Patterson and Parichy, 2013). jam3b mutant melanophore phenotypes were similar whether fish were wild-type for ltk (irid+, lower left) or mutant for ltk (irid–, lower right). (D) jam3b mutants expressing wild-type Jam3b mosaically in melanophores had partially rescued melanophore morphologies and patterns (upper panels; uninjected control, lower panel). Note that mitfa and the mitfa regulatory region used here are expressed in melanophores and melanoblasts, as well as xanthophores; the binucleate state revealed by nucVenus expression is typical of mature, well-spread melanophores (Eom et al., 2012; Saunders et al., 2019). |
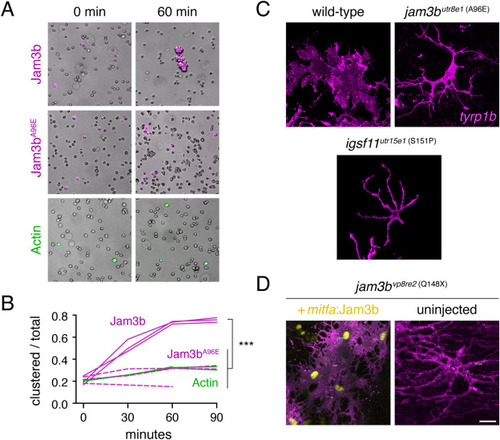
Jam3b promotes aggregation in vitro and an adherent morphology in vivo. (A) S2 cells transfected with constructs to express actin-GFP (control), wild-type Jam3b-mCherry or A96E mutant Jam3b-mCherry. Aggregates of cells expressing wild-type Jam3b formed within 60 min of rotary culture. (B) Quantification of transfected cells found within clusters relative to the total numbers of transfected cells in 3 replicate cultures. ∗∗∗, Tukey-Kramer post-hoc comparisons of means P < 0.0001 (overall ANOVA, F2,6 = 82.6, P < 0.0001; data were arcsine-transformed for analysis to correct heterogeneity of variance among groups). (C) Membrane-targeted mCherry revealed well-spread morphologies of wild-type melanophores but more dendritic morphologies of jam3butr8e1 and igsf11utr15e1 mutant melanophores in vivo. (D) Melanophores of jam3bvp8re2 mutants were also dendritic but adopted a more spread appearance when expressing wild-type Jam3b transgenically. Scale bars 20 μM (D, for C and D). |

Expression and function of jam3b relative to igsf11. (A) Melanophores isolated from larvae (7.5 SSL) and plated onto culture dishes expressed jam3b:Jam3b-mCherry and stained with polyclonal antiserum to Igsf11. (B) Fish heterozygous for both igsf11 and jam3b (here igsf11utr15e1 and jam3bvp8re2) had stripe breaks (upper) rather than wild-type stripes, as observed in fish heterozygous for both gja5b and jam3bvp8re2 (lower). (C) Jam3b-mCherry and Igsf11-EGFP supported homophilic but not heterophilic adhesion of S2 cells after 60 min in rotary culture. (D) Somatic loss of jam3b activity eliminated most residual hypodermal melanophores that develop in igsf11 mutants (here igsf11vp15rc5). Insets show higher magnification views including some persisting melanophores at the ventral margin of the flank (lower right). Scale bar, 10 μM (A). PHENOTYPE:
|
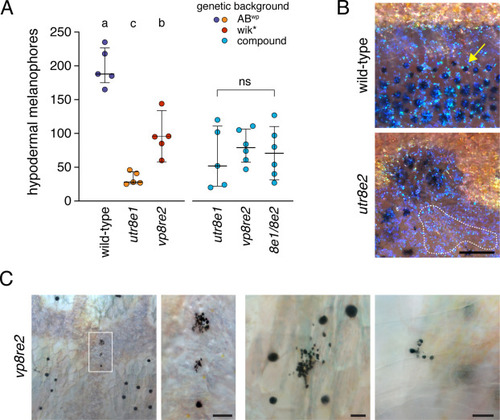
Pigmentary phenotypes of jam3b mutant adults. (A) Numbers of hypodermal melanophores along five segments at the level of the ventral primary melanophore stripe of wild-type and dorsal to the anal fin. Left side of plot indicates melanophores in wild-type and homozygous psrutr8e1 or psrvp8re2 mutants, as maintained in different genetic backgrounds. Each point represents an individual fish and bars show means ± 95% confidence intervals. Different letters indicate means significantly different in post hoc Tukey-Kramer comparisons (all P<0.005; overall ANOVA: F2,12=57.6, P<0.0001). Right side of plot shows lack of significant differences among allelic combinations in a common genetic background (F2,14=0.3, P=0.7488). (B) Details of iridophores typical of interstripes (yellow-gold iridescent cells) and stripes (blue iridescent cells) in both wild-type and psr mutants. Although blue stripe iridophores normally require melanophores for their development (Gur et al., 2020), patches of such iridophores that lacked associated melanophores were often evident in psr mutants (dashed line). Note that melanophore cell bodies and processes extend beyond regions of visible melanin (e.g., arrow) (Hamada et al., 2014), which concentrates towards cell centers during normal physiological modulation of melanosome dispersion and when fish are treated with epinephrine to contract melanosomes from the periphery (Fujii, 2000). Yellow–orange xanthophores are faintly visible over interstripe iridophores. (C) Melanized cell fragments in adult psrvp8re2 mutants. Left two panels, low magnification and detail of melanized debris in hypodermis. Right panels show additional examples in hypodermis and at the surface of a scale, typical of debris being extruded through the epidermis (Lang et al., 2009). Scale bars, 200 μM (B), 50 μM (C). |
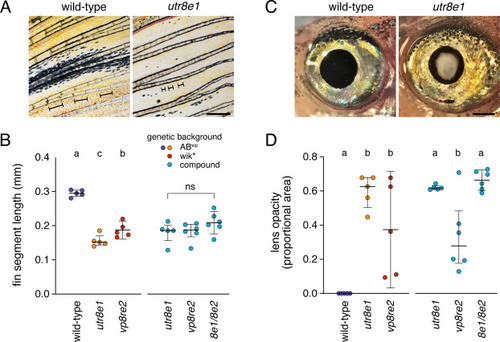
Fin and lens phenotypes of psr mutants. (A) Lepidotrichia of psr mutants were shorter and more variable in morphology than wild-type. Brackets in images indicate lengths of individual lepidotrichia. (B) Though alleles differed in lepidotrichial length when maintained in separate genetic backgrounds, combinations of mutant alleles did not differ in a common genetic background, similar to results for melanophores. Left side, Tukey-Kramer comparisons all P<0.05; overall F2,12=92.6, P<0.0001. Right side, overall F2,14=1.6, P=0.2350. (C) Lens opacity in psrutr8e1 adult at ∼1 year. (D) Proportional areas of opacities differed between alleles in original backgrounds and also in a common background. Left side, overall F2,12=14.8, P<0.0001. Right side, overall F2,14=10.7, P=0.0015. Tukey-Kramer comparisons of means all P<0.05 when letters above bars differ. Scale bars, 500 μM. |
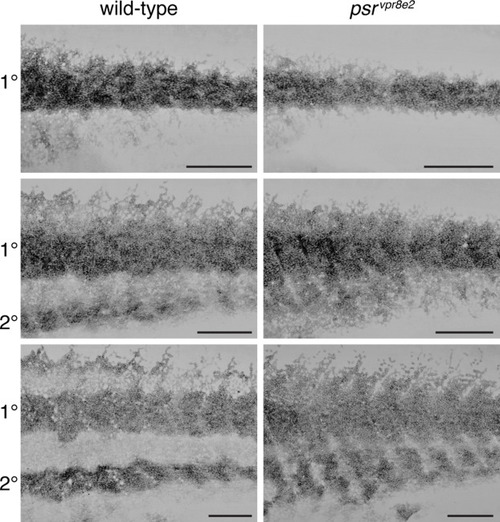
Development of iridophore pattern in psr mutants. Iridophores were labeled with membrane-targeted mCherry driven by regulatory elements of purine nucleotide phosphorylase 4a (pnp4a:mem-mCherry), which is expressed strongly in these cells (Gur et al., 2020; Spiewak et al., 2018). Pixel values are inverted. Wild-type and psr mutant siblings were imaged repeatedly on successive days through completion of the adult pattern, and two representative individuals are shown here at each of three stages (n = 6 wild-type and 5 psr mutants total). In wild-type, densely packed iridophores formed a primary (1°) interstripe, with more loosely arranged iridophores developing dorsally and ventrally in prospective stripes (top, 9.2 SSL). A secondary (2°) interstripe subsequently formed ventrally (middle, 10.9 SSL) and began to form dorsally (bottom, 13.4 SSL). In psr mutants, densely packed iridophores typical of interstripes were spread more widely over the flank. Scale bars, 500 μM. |

jam3b:Jam3b-mCherry expression during post-embryonic development. (A) Basal epidermal cells of the skin. (B) Superimposed brightfield and fluorescence of image of Jam3b-mCherry expression in lens of a juvenile fish. (C) Melanophores of the stripe. In brightfield (captured by photomultiplier tube; PMT) melanin is evident, contracted by epinephrine to centers of melanophores. Reflecting platelets of sparsely arranged stripe iridophores are also evident (e.g., arrow). Melanophores express mitfa:EGFP, with jam3b:Jam3b-mCherry accumulations at cell peripheries. In contrast to melanophores beneath them, stripe iridophores did not have detectable accumulation of Jam3b-mCherry. Asterisk, lipid droplet in underlying adipocyte. (D) In the interstripe, reflecting platelets of densely packed iridophores are apparent. In brightfield-PMT, accumulations of carotenoid pigments within xanthophores appear black (dashed circles). Iridophores and reflecting platelets are labeled with pnp4a:EGFP and Jam3b-mCherry is evident where cells contact one another. Scale bars, 20 μM (A,C,D), 500 μM (B). |

Cell transplants support a model in which jam3b functions autonomously to melanophores. (A) Wild-type cells that developed as melanophores formed a wild-type pattern when transplanted to mutant hosts that lack melanophore owing to a null allele of mitfa, which normally acts within the melanophore lineage (Eom et al., 2012; Lister et al., 1999; Parichy and Turner, 2003a). By contrast, jam3b mutant cells that developed as melanophores in this background retained patterns and morphologies typical of jam3b mutants (n=4 chimeras that developed jam3b donor melanophores). The same phenotypes were evident in transplants of jam3b mutant cells to albino mutant hosts, which develop melanophores that lack melanin (n=6 chimeras that developed jam3b mutant melanophores). (B) When iridophores wild-type for jam3b developed in a jam3b mutant background, host melanophores retained a mutant arrangement and appearance evident in brightfield (arrowheads, upper). In these experiments, donor cells were transplanted from embryos mutant for temperature-sensitive allele mitfavc7, and chimeras reared at restrictive temperature (32 °C), at which melanophores do not develop (Gur et al., 2020; Johnson et al., 2011; Zeng et al., 2015). Donors iridophores were marked by pnp4a:mem-mCherry expression (middle; merge with brightfield, lower) and images shown are stiched computationally from multiple image tiles. In both A and B other donor cell types may be present as well, though pigment cells rarely develop in close association with mesodermal or ectodermal derivatives in such transplants [e.g., Fig. 4; (Budi et al., 2008; Eom et al., 2012; Parichy and Turner, 2003a; Parichy et al., 2003). Scale bars, 500 μM. |
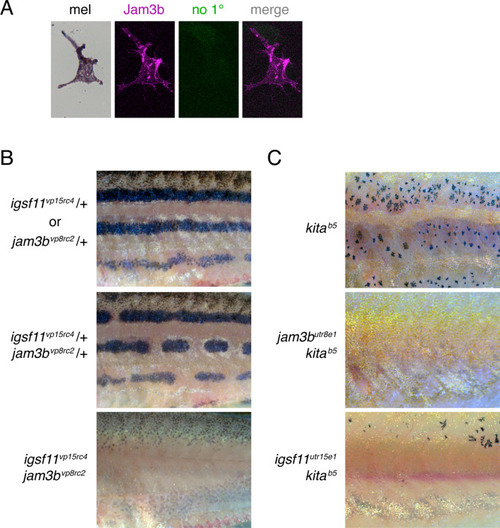
jam3b dependent melanophore development in mutants of igsf11 and kita. (A) No-primary antiserum control staining jam3b:Jam3b-mCherry+ melanophore imaged identically to melanophore in Fig. 6A. (B) Fish heterozygous for igsf11vp15rc4 or jam3bvp8rc2 had pigment patterns with only occasional breaks in otherwise wild-type stripes (upper). Fish heterozygous for both mutations had numerous stripe breaks (middle) and fish homozygous for both mutations lacked hypodermal melanophores over the middle flank but often developed lightly melanized melanophores along the ventral margin of the flank (lower). (C) A population of regulative melanophores develops in homozygous kita mutants (upper), but these cells were entirely missing (middle), or further reduced in number (lower), by simultaneous homozygous mutation of jam3b or igsf11. |
Reprinted from Developmental Biology, 476, Eom, D.S., Patterson, L.B., Bostic, R.R., Parichy, D.M., Immunoglobulin superfamily receptor junctional adhesion molecule 3 (Jam3) requirement for melanophore survival and patterning during formation of zebrafish stripes, 314-327, Copyright (2021) with permission from Elsevier. Full text @ Dev. Biol.