
- Title
-
Dose-Dependent Carbon-Dot-Induced ROS Promote Uveal Melanoma Cell Tumorigenicity via Activation of mTOR Signaling and Glutamine Metabolism
- Authors
- Ding, Y., Yu, J., Chen, X., Wang, S., Tu, Z., Shen, G., Wang, H., Jia, R., Ge, S., Ruan, J., Leong, K.W., Fan, X.
- Source
- Full text @ Adv Sci (Weinh)
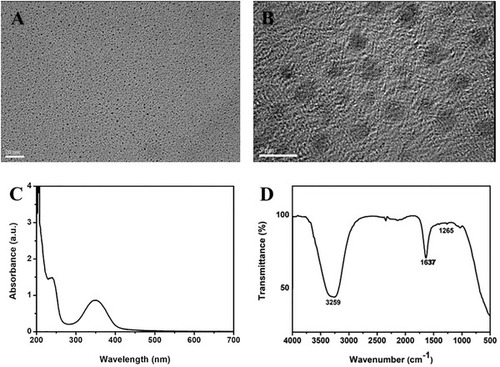
Cdot characterization. A,B) HRTEM images. Scale bars = 20 nm in panel (A) and 5 nm in panel (B). C) UV–vis absorbance spectrum. D) FTIR spectrum. |
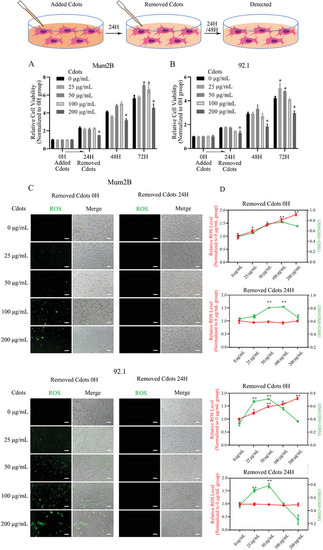
Cdots promote UM cell viability, ROS generation, and redox state balance. A,B) CCK‐8 assay results. Mum2B and 92.1 UM cells were cultured with Cdots for 24 h, Cdots were removed from the media, and the cells were cultured for another 48 h. After the 72 h period, Cdots at 50 and 100 µg mL−1 promoted Mum2B cell viability, and Cdots at 25 and 50 µg mL−1 promoted 92.1 cell viability. The results were compared to viability at time zero. C) Bright‐field and fluorescence images showing ROS levels in Cdot‐treated UM cells using a DCFH‐DA assay ( |
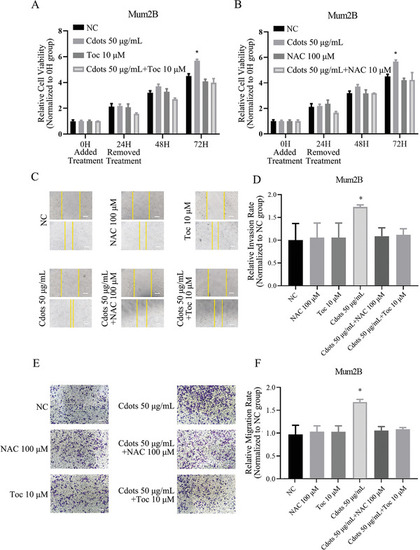
Cdots promote UM cell viability, migration, and invasiveness by inducing ROS. A,B) Addition of the antioxidants Toc and NAC reversed the Cdot‐induced proviability effect in Mum2B cells. The results were compared to those of the NC group. C) Microscopy images of Mum2B cells treated with Cdots with or without antioxidants in a cell scratch migration assay. Scale bars = 100 µm. D) Quantitation of Mum2B cell migration distance from the images presented in panel (C). Addition of the antioxidants reversed the Cdot‐induced promigration effect. The results were compared to those of the NC group. E) Microscopy images of Mum2B cells treated with Cdots with or without antioxidants in a Transwell cell invasion assay. F) Quantitation of the cell invasion images shown in panel (E). The addition of antioxidants reversed the Cdot‐induced proinvasion effect. The results were compared to those of the NC group. Asterisks indicate a statistically significant difference between the control and treatment groups. |
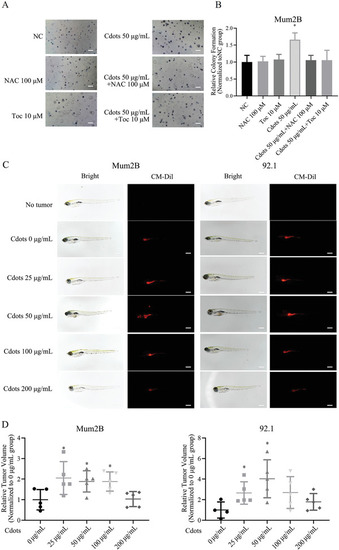
Exposure of UM cells to Cdots promotes tumorigenesis by inducing ROS. A) Images of UM cells exposed to Cdots and/or the antioxidants NAC or Toc. B) Quantitation of colony number. The addition of the antioxidants NAC or Toc reversed the Cdot‐induced procolony formation effect. The results were compared to those of the NC group. |
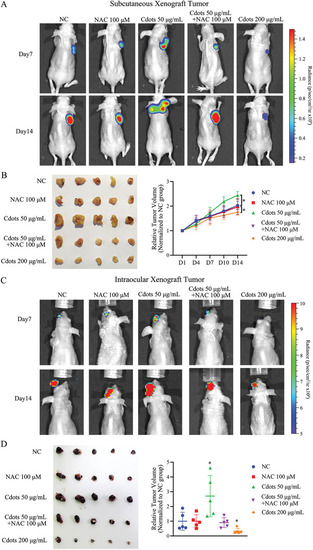
Exposure of UM cells to Cdots promotes tumorigenesis by inducing ROS in both nude mouse subcutaneous and intraocular xenograft models. A) Luciferase images of tumor‐bearing mice at various time points after subcutaneous injections of pretreated UM cells. Addition of the antioxidant NAC reversed the Cdot‐induced tumorigenic effect. Cdots at 200 µg mL−1 inhibited tumor growth. B) Tumors were compared at the end of the experiment. Tumor growth curves were measured starting at 1 d after inoculation ( |
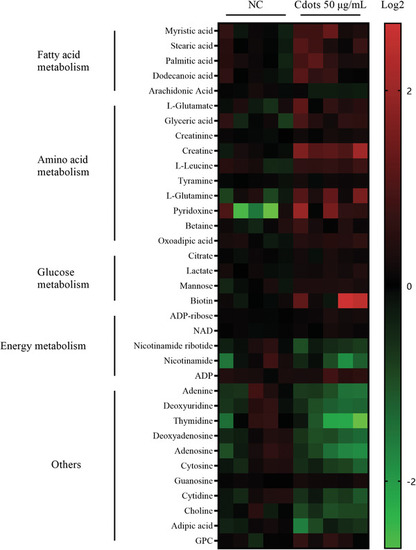
Cdot‐induced ROS increase amino acid and fatty acid metabolism. Heatmap depicting changes in metabolite concentration between control and 50 µg mL−1 Cdot‐treated Mum2B cells (p < 0.05). Intracellular metabolites were analyzed by LC‐MS. Red indicates increased metabolite abundance and green indicates decreased metabolite abundance. |
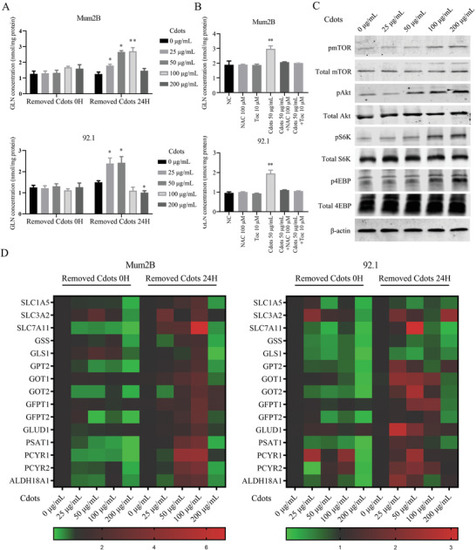
Cdot‐induced ROS activate mTOR signaling and increase the expression of downstream glutamine metabolism‐related genes. A) UM intracellular glutamine content increased in a Cdot‐concentration‐dependent manner after removal of Cdots and 24 h of additional culture. B) Addition of the antioxidants NAC and Toc reversed the Cdot‐induced upregulation of intracellular glutamine concentration. C) Western blots showing that pAkt, pmTOR, pS6K, and p4EBP protein levels increased in a Cdot‐concentration‐dependent manner after removal of Cdots and 24 h of additional culture. Total Akt, total mTOR, total S6K, total 4EBP, and |
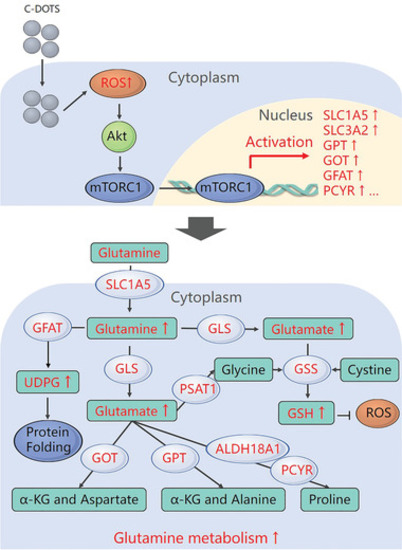
Schematic of the effects of Cdots on glutamine metabolism in tumor cells. |
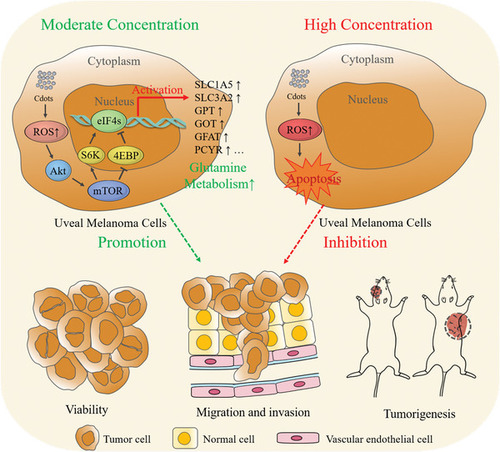
Schematic of the opposing Cdot‐concentration‐dependent effects on tumor cell progression and metastasis. At moderate Cdot concentrations, Cdot‐induced ROS promote tumor cell growth and invasiveness. At high Cdot concentrations, overwhelming ROS production causes tumor cell apoptosis. |