FIGURE

Figure 4

ID
ZDB-FIG-210428-75
Publication
Ding et al., 2021 - Dose-Dependent Carbon-Dot-Induced ROS Promote Uveal Melanoma Cell Tumorigenicity via Activation of mTOR Signaling and Glutamine Metabolism
Other Figures
All Figure Page
Back to All Figure Page
Figure 4

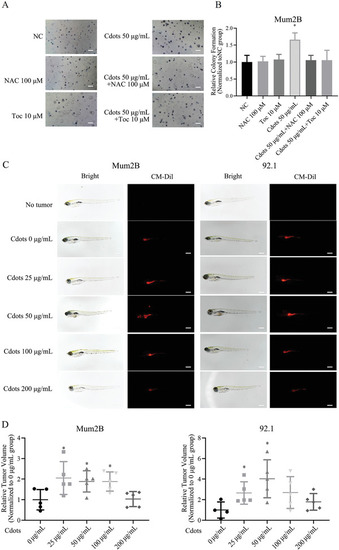
Exposure of UM cells to Cdots promotes tumorigenesis by inducing ROS. A) Images of UM cells exposed to Cdots and/or the antioxidants NAC or Toc. B) Quantitation of colony number. The addition of the antioxidants NAC or Toc reversed the Cdot‐induced procolony formation effect. The results were compared to those of the NC group. n = 3. C) Bright‐field and fluorescence images of zebrafish transplanted with UM cells labeled with CM‐Dil dye and exposed to Cdots at different concentrations (n = 5 for each group). D) Quantitation of tumor volume in fluorescence images. Cdots at 25, 50, and 100 µg mL−1 promoted Mum2B cell tumorigenicity and Cdots at 25 and 50 µg mL−1 promoted 92.1 cell tumorigenicity. The results were compared to those of the 0 µg mL−1 group. Asterisks indicate a statistically significant difference between the control and treatment groups. n = 5, *P < 0.05. Scale bars = 100 µm.

Expression Data

Expression Detail
Antibody Labeling
Phenotype Data

Phenotype Detail
Acknowledgments
This image is the copyrighted work of the attributed author or publisher, and ZFIN has permission only to display this image to its users. Additional permissions should be obtained from the applicable author or publisher of the image. Full text @ Adv Sci (Weinh)