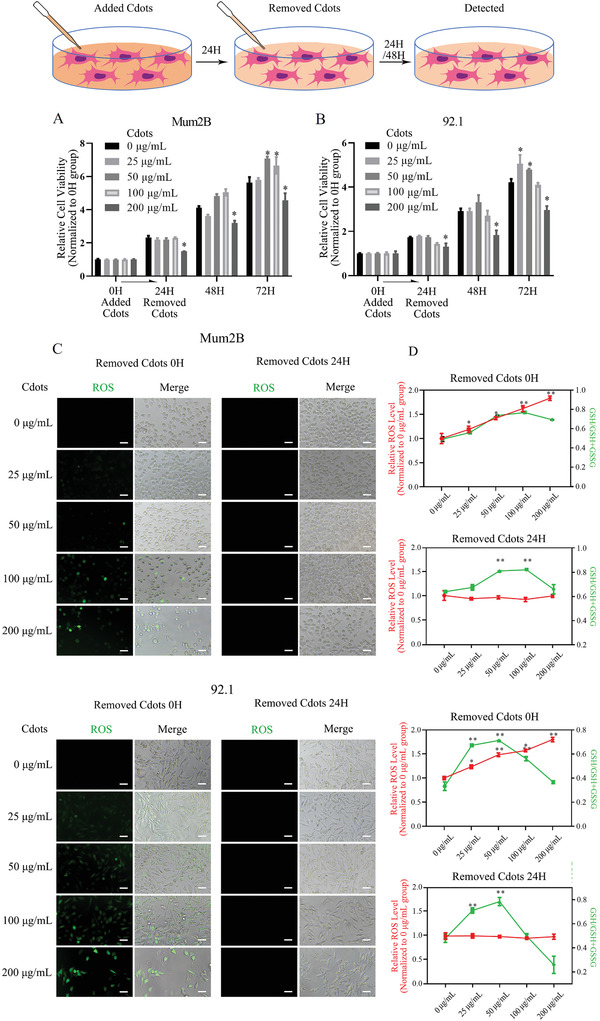
IMAGE

Figure 2

ID
ZDB-IMAGE-210428-73
Source
Figures for Ding et al., 2021
Image
Figure Caption

Figure 2

Cdots promote UM cell viability, ROS generation, and redox state balance. A,B) CCK‐8 assay results. Mum2B and 92.1 UM cells were cultured with Cdots for 24 h, Cdots were removed from the media, and the cells were cultured for another 48 h. After the 72 h period, Cdots at 50 and 100 µg mL−1 promoted Mum2B cell viability, and Cdots at 25 and 50 µg mL−1 promoted 92.1 cell viability. The results were compared to viability at time zero. C) Bright‐field and fluorescence images showing ROS levels in Cdot‐treated UM cells using a DCFH‐DA assay (n = 3 for each group). Scale bars = 50 µm. D) Quantification of ROS levels (red line) using a fluorometer showed that Cdots caused a concentration‐dependent increase in ROS after 24 h of culture. The ROS levels diminished after Cdots were removed for 48 h. A GSH/GSH + GSSG assay (green line) showed that Cdots increased the GSH/GSH + GSSG ratio at 50 and 100 µg mL−1 in Mum2B cells and at 25 and 50 µg mL−1 in 92.1 cells. The results were compared to those of the 0 µg mL−1 group. Asterisks indicate a statistically significant difference between the control and treatment groups. n = 3, *P < 0.05, **P < 0.01.

Acknowledgments
This image is the copyrighted work of the attributed author or publisher, and ZFIN has permission only to display this image to its users. Additional permissions should be obtained from the applicable author or publisher of the image. Full text @ Adv Sci (Weinh)