
FIGURE
Figure 1
- ID
- ZDB-FIG-210428-71
- Publication
- Ding et al., 2021 - Dose-Dependent Carbon-Dot-Induced ROS Promote Uveal Melanoma Cell Tumorigenicity via Activation of mTOR Signaling and Glutamine Metabolism
- Other Figures
- All Figure Page
- Back to All Figure Page
Figure 1
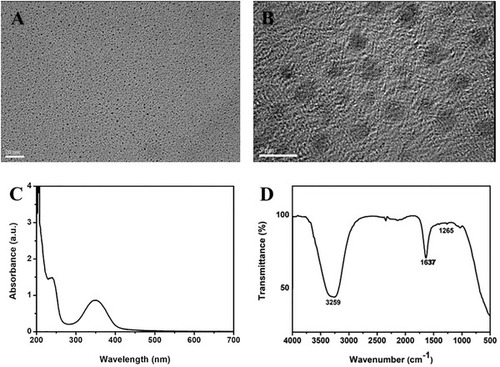
Cdot characterization. A,B) HRTEM images. Scale bars = 20 nm in panel (A) and 5 nm in panel (B). C) UV–vis absorbance spectrum. D) FTIR spectrum. |
Expression Data
Expression Detail
Antibody Labeling
Phenotype Data
Phenotype Detail
Acknowledgments
This image is the copyrighted work of the attributed author or publisher, and
ZFIN has permission only to display this image to its users.
Additional permissions should be obtained from the applicable author or publisher of the image.
Full text @ Adv Sci (Weinh)