
Image
|
Figure Caption
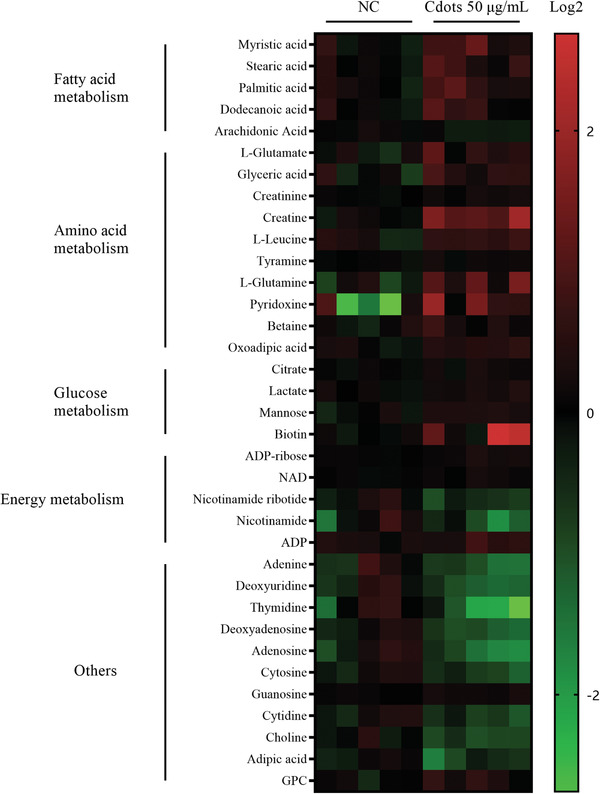
Figure 6 Cdot‐induced ROS increase amino acid and fatty acid metabolism. Heatmap depicting changes in metabolite concentration between control and 50 µg mL−1 Cdot‐treated Mum2B cells (p < 0.05). Intracellular metabolites were analyzed by LC‐MS. Red indicates increased metabolite abundance and green indicates decreased metabolite abundance.
Acknowledgments
This image is the copyrighted work of the attributed author or publisher, and
ZFIN has permission only to display this image to its users.
Additional permissions should be obtained from the applicable author or publisher of the image.
Full text @ Adv Sci (Weinh)