
- Title
-
The X-linked acrogigantism-associated gene gpr101 is a regulator of early embryonic development and growth in zebrafish
- Authors
- Trivellin, G., Tirosh, A., Hernández-Ramírez, L.C., Gupta, T., Tsai-Morris, C.H., Faucz, F.R., Burgess, H.A., Feldman, B., Stratakis, C.A.
- Source
- Full text @ Mol. Cell. Endocrinol.
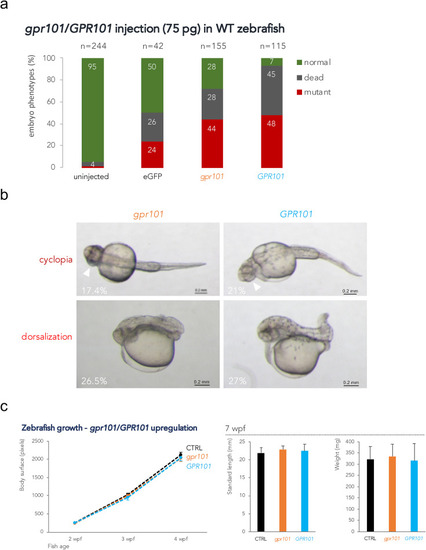
Fig. 1. gpr101/GPR101 exogenous expression experiments. a) WT embryos were injected with 75 pg of mRNA and scored at 1 dpf. About 40% of embryos showed a mutant phenotype after either gpr101 or GPR101 injection. Injection with eGFP mRNA resulted in 24% of embryos with non-specific phenotypes. The total number of analyzed embryos is shown at the top of each column. Data shown are from one representative experiment. For each experiment, two expert operators performed injections. b) The two main phenotypes observed in gpr101/GPR101 injected embryos – cyclopia and dorsalization – are shown, together with their frequency. The white arrowheads indicate the fused eyes. Upper panels: ventral view; lower panels: lateral view. Anterior is left. Scale bar: 200 μm. c) Growth trajectories in eGFP (controls, black), gpr101 (orange) and GPR101 (light blue) injected embryos. Body surface was measured in larvae at 2 (eGFP, n = 17; gpr101, n = 21; GPR101, n = 20), 3 (eGFP, n = 17; gpr101, n = 21; GPR101, n = 19), and 4 (eGFP, n = 16; gpr101, n = 19; GPR101, n = 19) wpf (left panel), while standard length and body weight were measured in 7 wpf juvenile fish (eGFP, n = 16; gpr101, n = 18; GPR101, n = 19; right panel). No significant differences in growth among the three groups were observed at any of the analyzed time points. |
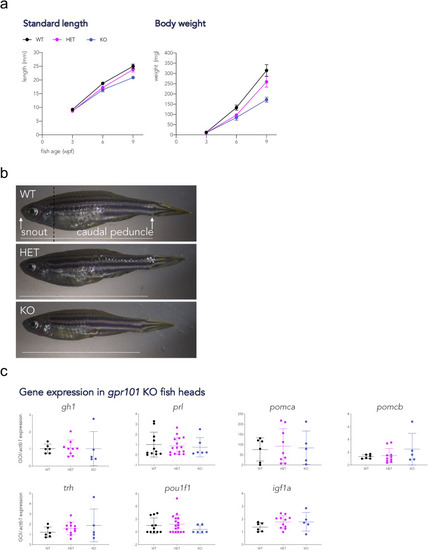
Fig. 2. Growth trajectories and gene expression in gpr101 KO zebrafish. A) Standard length and body weight were measured at 3, 6, and 9 wpf in WT (black), heterozygous (HET, purple), and full gpr101 KO (blue) fish. The experiment was performed in two independent sets of fish and the data presented together. The number of fish for each genotype at all time points is given in Supplementary Fig. 7a. Data were analyzed by a two-way ANOVA; main effect of genotype, p < 0.0001 for all variables. b) Representative images of 9 wpf female fish belonging to the three genotypes. The way standard length (distance snout-caudal peduncle) was measured is shown as a horizontal white dashed line in the upper panel. The vertical black dashed line in the upper panel shows where deeply anesthetized fish were decapitated for gene expression experiments. c) The mRNA expression of a transcription factor involved in pituitary development (pou1f1), a GH-dependent growth regulator (igf1a), and pituitary and hypothalamic hormones (the rest), was measured by RT-qPCR at a juvenile stage (6 wpf) in WT (n = 11 for prl and pou1f1, n = 6 for the rest), HET (n = 17 for prl and pou1f1, n = 11 for the rest), and KO (n = 11 for prl and pou1f1, n = 6 for the rest), HET (n = 6 for prl and pou1f1, n = 5 for the rest). actb1 was used as endogenous control. None of these comparisons showed a significant difference between genotypes. GOI: gene of interest. EXPRESSION / LABELING:
|
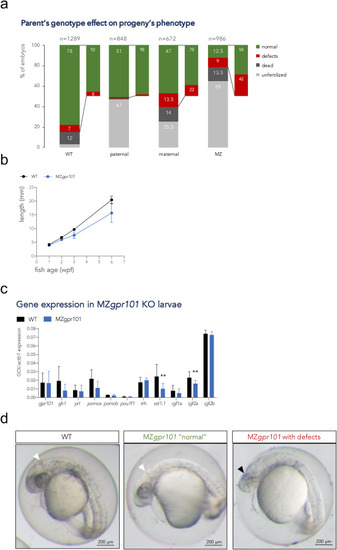
Fig. 3. Characterization of MZgpr101 mutants. a) Embryos from parents of four different genotypic combinations were generated to assess the parent-of-origin's contribution to phenotypes: WT (gpr101+/+ embryos from 4 crosses), paternal mutants (gpr101+/− embryos from 4 crosses, which have the maternal and zygotic gpr101, but lack potential paternal gpr101), maternal mutants (gpr101+/− embryos from 1 harem cross consisting of two females and two males, which lack maternal, but contain zygotic and potential paternal gpr101), maternal zygotic (MZ, gpr101−/− embryos from five crosses, which lack maternal, zygotic and potential paternal gpr101). Each column indicates the percentage of phenotypes observed at morphological inspection at 1 dpf. The total number of analyzed embryos is shown at the top of each column. For the WT controls crosses, 485 fertilized embryos out of 1289 eggs were assessed; for the maternal cross, 128 fertilized embryos out of 672 eggs were assessed. b) Growth measurements for single-housed WT (black) and MZgpr101 mutants (blue). Standard length was measured at 1, 2, 3, and 6 wpf. The number of fish for each genotype at all time points is given in Supplementary Fig. 8a. Data were analyzed by a two-way ANOVA; p < 0.001. c) The mRNA expression of gpr101, pituitary and hypothalamic genes, and growth regulators was measured by RT-qPCR in 1 wpf larvae. actb1 was used as endogenous control. GOI: gene of interest. *, p < 0.05; **, p < 0.01. d) Representative WT (left panel) and MZgpr101 embryos showing a WT-looking embryo ("normal", middle panel) and an embryo lacking the midbrain-hindbrain boundary and showing brain necrosis (right panel). Seven out of 61 fertilized embryos (11.5%) presented with midbrain-hindbrain boundary defects and necrotic areas in the brain. The white arrowhead indicates the midbrain-hindbrain boundary, while the black arrowhead indicates a necrotic area. Anterior is left. Scale bar: 200 μm. EXPRESSION / LABELING:
PHENOTYPE:
|
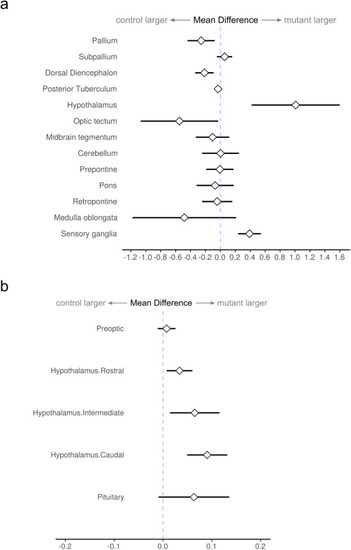
Fig. 4. Morphometric analysis of MZgpr101 mutant brains. a) Graph displays changes in the relative volume of major brain divisions at 6 dpf (n = 21, 22 control, mutant). Graph shows the mean difference and 95% confidence interval between the percentage of the brain occupied by each division in mutants compared to controls. b) Subdivisions of the hypothalamic-pituitary unit are expanded in mutants. PHENOTYPE:
|
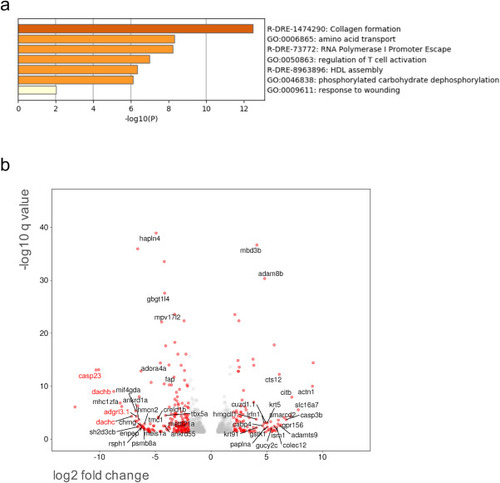
Fig. 5. Transcriptomic analysis in gpr101 KO unfertilized eggs. a) Pathway enrichment analysis in mature, unfertilized eggs collected from WT (n = 4) and gpr101 KO (n = 3) females was performed with Metascape by selecting the custom analysis option and uploading a background list of genes appropriate for the developmental stage under study (1-cell stage). The list was extracted from White et al. (White et al., 2017). Out of the 613 differentially expressed (DE) genes (±1 log2 fold change threshold), 557 genes were recognized by the software when applying these parameters. The top non-redundant enrichment cluster was collagen formation. b) Volcano plot showing significant DE genes (q < 0.05). Genes with a log2 fold change < −1 or > 1 are shown as red dots, the rest as grey dots. The names of genes (only those with an assigned name) with a log2 fold change < −4 or > 4 and q < 0.01 are shown. Selected genes showing the highest negative fold change and significance values were validated by RT-qPCR/RT-PCR and their names are reported in red. |
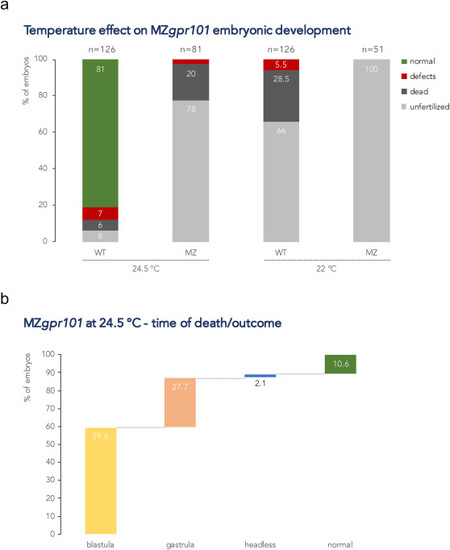
Fig. 6. MZgpr101 mutants are temperature-sensitive. a) Lower incubation temperatures (22 and 24.5 °C) adversely affect MZgpr101 embryonic development. Each column indicates the percentage of phenotypes observed at morphological inspection at 1 dpf. The total number of analyzed embryos is shown at the top of each column. b) MZgpr101 (n = 48) and WT (n = 17) fertilized embryos were reared at 24.5 °C and analyzed by time-lapse microscopy from 1-cell stage to 24 hpf. All WT embryos developed normally. The graph shows the percentage of MZgpr101 embryos that died at either the blastula or gastrula stages, and the phenotypes and percentage of the surviving embryos. |
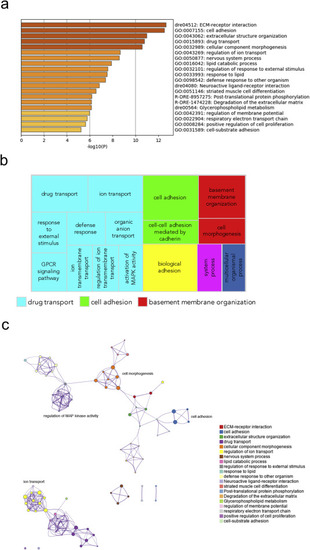
Fig. 7. Pathway and network analysis at the onset of gastrulation (50% epiboly) in MZgpr101 mutants. a) Pathway enrichment analysis was performed with Metascape by selecting the custom analysis option and uploading a background list of genes appropriate for the developmental stage under study. The list was extracted from White et al. (White et al., 2017). Out of the 1008 DE genes (±2 log2 fold change threshold), 785 genes were recognized by the software when applying these parameters. The top non-redundant enrichment clusters are shown. b) Gene ontology (GO) treemap based on the enrichment of the most differentially expressed transcripts. GOrilla was used to determine enrichment of transcripts based on the minimum hypergeometric scoring method. Redundant GO terms were filtered with the GO Trimming tool and then visualized with REViGO. Each box is a single cluster representative. Box sizes correlate to the –log10 p value of the GO-term enrichment. Boxes with the same color are grouped by semantic similarity (SimRel, similarity = 0.7) into superclusters of loosely related terms. Drug transport and cell adhesion were confirmed among the most enriched superclusters. c) Network analysis was performed with Metascape using the settings outlined above for pathway analysis. |
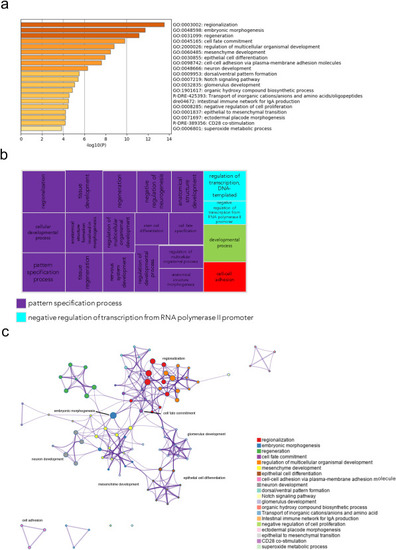
Fig. 8. Pathway and network analysis at the onset of gastrulation (50% epiboly) in embryos with exogenous gpr101 expression. a) Pathway enrichment analysis was performed with Metascape by selecting the custom analysis option and uploading a background list of genes appropriate for the developmental stage under study. The list was extracted from White et al. (White et al., 2017). Out of the 313 DE genes (no log2 fold change threshold chosen), 300 genes were recognized by the software when applying these parameters. The top non-redundant enrichment clusters are shown. b) Gene ontology (GO) treemap based on the enrichment of the most differentially expressed transcripts. GOrilla was used to determine enrichment of transcripts based on the minimum hypergeometric scoring method. Redundant GO terms were filtered with the GO Trimming tool and then visualized with REViGO. Each box is a single cluster representative. Box sizes correlate to the –log10 p value of the GO-term enrichment. Boxes with the same color are grouped by semantic similarity (SimRel, similarity = 0.7) into superclusters of loosely related terms. Pattern specification process was the most predominant supercluster. c) Network analysis was performed with Metascape using the settings outlined above for pathway analysis. |

ZFIN is incorporating published figure images and captions as part of an ongoing project. Figures from some publications have not yet been curated, or are not available for display because of copyright restrictions. EXPRESSION / LABELING:
|
|
ZFIN is incorporating published figure images and captions as part of an ongoing project. Figures from some publications have not yet been curated, or are not available for display because of copyright restrictions. PHENOTYPE:
|
|
ZFIN is incorporating published figure images and captions as part of an ongoing project. Figures from some publications have not yet been curated, or are not available for display because of copyright restrictions. PHENOTYPE:
|
|
Unillustrated author statements PHENOTYPE:
|
Reprinted from Molecular and Cellular Endocrinology, 520, Trivellin, G., Tirosh, A., Hernández-Ramírez, L.C., Gupta, T., Tsai-Morris, C.H., Faucz, F.R., Burgess, H.A., Feldman, B., Stratakis, C.A., The X-linked acrogigantism-associated gene gpr101 is a regulator of early embryonic development and growth in zebrafish, 111091, Copyright (2020) with permission from Elsevier. Full text @ Mol. Cell. Endocrinol.