FIGURE SUMMARY
Title

Live Imaging of Heart Injury in Larval Zebrafish Reveals a Multi-Stage Model of Neutrophil and Macrophage Migration

Authors
Kaveh, A., Bruton, F.A., Buckley, C., Oremek, M.E.M., Tucker, C.S., Mullins, J.J., Taylor, J.M., Rossi, A.G., Denvir, M.A.
Source
Full text @ Front Cell Dev Biol

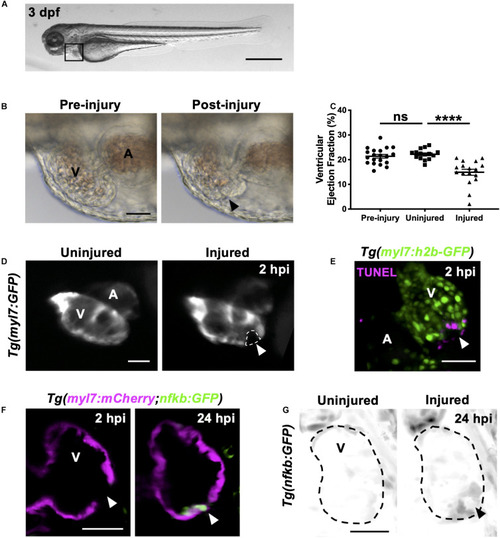
Heart laser injury causes localized cardiomyocyte cell death. (A) Whole larva brightfield image of 3 dpf zebrafish with heart region indicated (black square), scale bar = 500 μm. (B) Brightfield images of a 3 dpf larval heart pre-laser injury (left) and 1-min post laser injury (right). The lesion is seen as a thickened and partially collapsed region at the ventricular apex (black arrowhead). (C) Ventricular ejection fraction before injury, and 2 hpi in injured and uninjured larvae. Error bars = SEM, n = 15–20 larvae, experimental n = 3. Unpaired t-test performed between groups where **** p < 0.0001. (D) Epifluorescence images of an uninjured and injured Tg(myl7:GFP) heart. Injury site is marked by a loss of myocardial GFP at the ventricular apex (white dashed line and arrowhead). (E) 3D LSFM image of a TUNEL stained injured Tg(myl7:h2b-GFP) heart at 2 hpi. Injury site is marked by a loss of nuclear myocardial GFP (white arrowhead) bordered by TUNEL positive cells (magenta). Image displayed as a maximum intensity projection (MIP). (F) LSFM single z-plane image of a Tg(myl7:mCherry;nfkb:GFP) ventricle at 2 and 24 hpi following heart injury. White arrowheads indicate loss of myocardial signal at 2 hpi and upregulation of nfkb:GFP in wound-bordering cardiomyocytes at 24 hpi. (G) 3D LSFM image of Tg(nfkb:GFP) ventricular expression at 24 hpi in uninjured and injured larvae (black arrowhead indicates ventricular apex injury site). Image displayed as a MIP (inverse color map). All scale bars = 50 μm unless stated otherwise. V, ventricle; A, atrium; ns, non-significant.

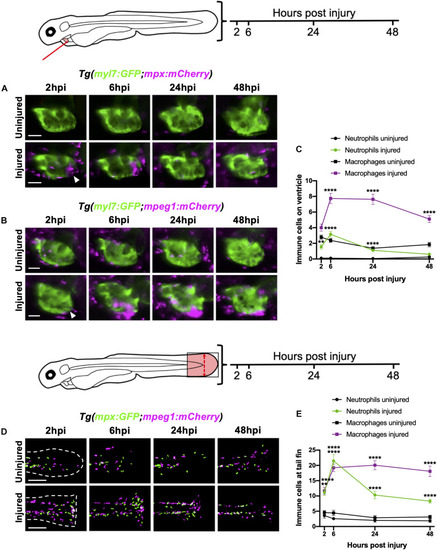
Neutrophils and macrophages display distinct recruitment dynamics during heart injury comparable to tail fin injury. (A) Epifluorescence heart images of uninjured and injured Tg(myl7:GFP;mpx:mCherry) larvae displaying neutrophil accumulation at 2, 6, 24 and 48 hpi, scale bar = 50 μm. (B) Epifluorescence heart images of uninjured and injured Tg(myl7:GFP;mpeg1:mCherry) larvae displaying macrophage accumulation at 2, 6, 24 and 48 hpi, scale bar = 50 μm. Arrowheads indicate ventricular apex injury site. (C) Neutrophil and macrophage numbers on the ventricle at 2, 6, 24 and 48 hpi for uninjured and injured larvae. Error bars = SEM, n = 19 larvae, experimental n = 3. (D) Epifluorescence tail images of uninjured and injured Tg(mpx:GFP;mpeg1:mCherry) larvae displaying neutrophil (green) and macrophage (magenta) accumulation at the timepoints 2, 6, 24 and 48 hpi, scale bar = 60 μm. White dashed line indicates outline of tail fin. (E) Neutrophil and macrophage numbers at the tail fin at 2, 6, 24, and 48 hpi for uninjured and injured larvae. Error bars = SEM, n = 10 larvae for uninjured groups and n = 13 for transected groups, experimental n = 3. Two-way ANOVA and Sidak post hoc test performed for immune cell comparisons between uninjured and injured groups where ** p < 0.001, **** p < 0.0001. Immune cell counts were made from the region of interest (highlighted red) in the corresponding schematics.

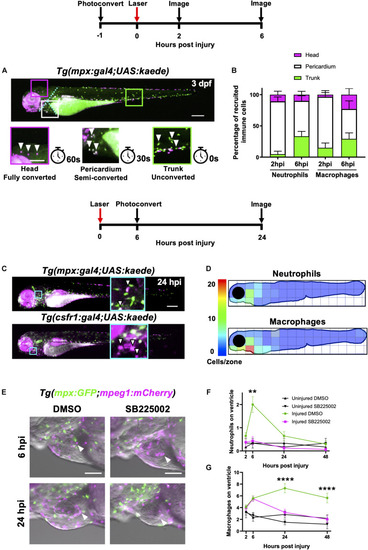
Heart injury recruits local immune cells from the pericardium and head but also cells from distal immune reservoirs. (A) Outline of experimental timeline to trace recruited immune cell tissue-origins. Whole body image of a Tg(mpx:gal4;UAS:kaede) larva where green cells, unconverted kaede; white cells (magenta and green), semi-converted kaede; and magenta cells, fully converted kaede. The larva is partitioned into three conversion areas marked by the cyan dotted line. Photoconversion of each area was achieved using a mercury lamp. Selected regions (boxes) within the three conversion areas are magnified in the lower panels along with the light exposure time for each level of conversion. White arrowheads, cells from each photoconverted region. Pigment in the eye and peripheries of the trunk autofluorescence magenta but are distinguishable from photoconverted cells because they are immobile. Upper panel scale bar = 200 μm and lower panel scale bar = 100 μm. (B) Percentage tissue origin of neutrophils and macrophages recruited to the injured ventricle at 2 and 6 hpi. Error bars = SEM, n = 11–21 larvae, experimental n = 3. (C) Outline of experimental timeline to trace immune cell reverse migration dispersal following heart injury. Whole body image of pericardially photoconverted Tg(mpx:gal4;UAS:kaede) (top panel) and Tg(csf1r:gal4;UAS:kaede) (bottom panel). Examples of converted cells (white arrow heads) are shown in magnified panels (cyan). Unconverted kaede (green), converted kaede (magenta), arrowheads, examples of converted cells, scale bar = 200 μm. (D) Heatmap of a 24 hpi larvae summarizing the dispersal of photoconversion-tracked neutrophils (top panel) and macrophages (bottom panel) following heart injury. Individual zone size = 31000 μm2 and mean cell count normalized per zone, n = 17. (E) Epifluorescence images overlaid on a brightfield image showing neutrophil and macrophage numbers following laser heart injury in Tg(mpx:GFP;mpeg1:mCherry) larvae treated with Cxcr1/2 antagonist SB225002 (5 μM) or DMSO (0.1%) vehicle. Arrowheads, ventricular apex injury site. Scale bar = 100 μm. (F) Neutrophil numbers on the ventricle following laser injury in Tg(mpx:GFP;mpeg1:mCherry) larvae treated with Cxcr1/2 antagonist SB225002 (5 μM) or DMSO (0.1%) vehicle. (G) Macrophage numbers on the ventricle following laser injury in Tg(mpx:GFP;mpeg1:mCherry) larvae treated with Cxcr1/2 antagonist SB225002 (5 μM) or DMSO (0.1%) vehicle. Two-way ANOVA and Tukey post hoc test performed for immune cell comparisons between injured SB225002-treated and injured DMSO vehicle-treated larvae where ** p < 0.01 and **** p < 0.0001. Error bars = SEM, n = 17 larvae, experimental n = 3.

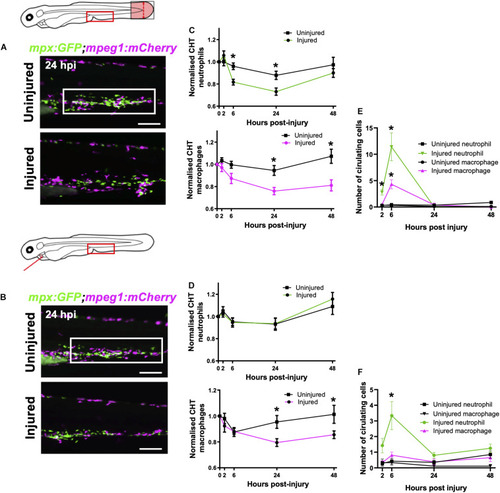
Macrophages are mobilized from the CHT and neutrophils are mobilized into peripheral blood following tail and heart injury. (A,B) Epifluorescence images of Tg(mpx:GFP;mpeg1:mCherry) larval caudal hematopoietic tissue (CHT) at 24 hpi (macrophages, magenta and neutrophils, green) following tail transection (A) and laser heart injury (B). White boxes, area of quantification. Scale bar = 200 μm. (C,D) Total CHT neutrophil and macrophage cell area based on normalized fluorescence using Tg(mpx:GFP;mpeg1:mCherry) larvae, n = 19 larvae, experimental n = 3. Values at each timepoint, cell type (neutrophil and macrophage) and injury model (heart laser and tail transection) are indicated. (E) Numbers of neutrophils and macrophages in the circulatory system following tail transection, n = 16 larvae, experimental n = 3. (F) Numbers of neutrophils and macrophages in the circulatory system following heart laser injury, n = 16 larvae, experimental n = 3. For all graphs, error bars, SEM and comparisons between uninjured, transected or laser injured groups was performed by Two-way ANOVA followed by Sidaks multiple comparison test where * p < 0.05.

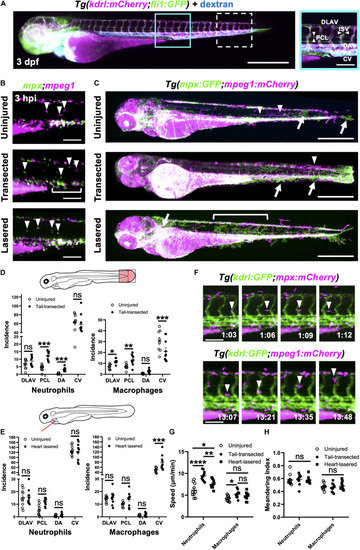
Neutrophils and macrophages utilize blood and lymphatic vessel surfaces for migration following injury. (A) Epifluorescence image of a 3dpf Tg(kdrl:mCherry;fli1:eGFP) whole larva injected with blue fluorescent 500 kDa dextran highlighting the entire cardiovascular network. Cyan box, region used for quantification for (D), which is magnified in the right panel. White dashed box = region used for quantification for (E). The right panel (A magnified) is annotated with vessels monitored for subsequent route use analysis. Left panel scale bar = 500 μm and the right panel scale bar = 100 μm. (B) Epifluorescence images of the peri-cloaca trunk region of Tg(mpx:GFP;mpeg1:mCherry) larvae at 3 hpi in uninjured, tail transected and heart lasered larvae. Neutrophils, green and macrophages, magenta. White bracket indicates a partially emptied CHT and white arrowheads CHT-liberated neutrophils and macrophages. Scale bar = 100 μm. (C) Epifluorescence images superimposed over 4–8 hpi to generate neutrophil (green) and macrophage (magenta) pseudotracks in whole Tg(mpx:GFP;mpeg1:mCherry) uninjured, tail transected and heart lasered larvae. White arrowheads highlight representative macrophage tracks, white arrows highlight representative neutrophil tracks and the white bracket highlights a region of neutrophil ventro-dorsal migration. Scale bar = 500 μm. (D,E) Incidence of vessel use by neutrophils or macrophages in larvae between 1–12 hpi following tail transection (D) or laser heart injury (E). Injured groups were compared to uninjured groups using multiple t-tests with subsequent FDR correction using two stage step-up of Benjamini, Kreiger and Yekutieli, where *p < 0.05, **p < 0.01, and *** p < 0.001, n = 10 larvae analyzed per group. (F) Epifluorescence image sequence from heart lasered larvae showing a neutrophil migrating along the PCL (top) and a macrophage migrating up an ISV (bottom). Hours post injury as indicated. Scale bar = 100 μm. Neutrophil and macrophage speed (G) and meandering index (H) across the trunk 1.5–8 hpi in tail transected, heart lasered or uninjured larvae. Comparisons between groups were carried out using one-way ANOVA followed by Sidak-Holm multiple comparison test where * p < 0.05, ** p < 0.01 and **** p < 0.0001, n = 10 larvae analyzed per group. Error bars for all graphs, SEM; Ns, non-significant; DLAV, dorsal lateral anastomotic vessel; PCL, parachordal lymphatic; DA, dorsal aorta; ISV, intersegmental vessels; and CV, cardinal vein.

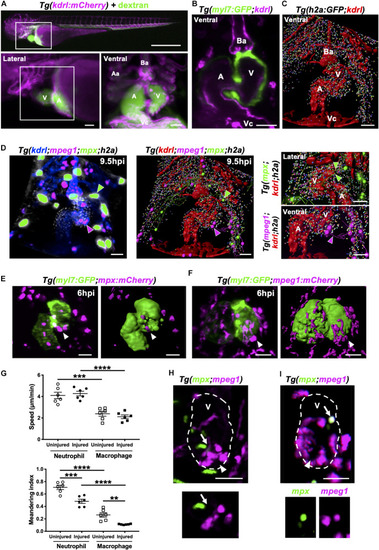
Neutrophils and macrophages migrate onto the ventricle via the pericardium and adopt specific migratory behaviors once on the ventricle following injury. (A) Epifluorescence image of Tg(kdrl:mCherry) larva injected with blue fluorescent 500 kDa dextran (colored green) to analyze the surrounding pericardium for vasculature (white box). Scale bar = 500 μm (top). Magnified epifluorescence image of the surrounding pericardium where white box indicates the nearby heart region (lower left). Magnified 3D LSFM image displaying the hearts vasculature (magenta) containing fluorescent dextran (green) (lower right). (B) LSFM z-plane of Tg(myl7:GFP;kdrl:mCherry) larva displaying the hearts myocardium and endothelium. (C) Surface rendered LSFM z-stack of Tg(h2a:GFP;kdrl:mCherry) larva displaying the hearts vasculature and surrounding pericardium. (D) LSFM fluorescence z-stack differentially color-labeled (left) and surface rendered z-stack (middle and right) of Tg(kdrl:mCherry;mpeg1:mCherry;mpx:GFP;h2a:GFP) larva displaying the heart vasculature (blue or red), pericardium (gray or multi-colored), neutrophils (green) and macrophages (magenta) at 9.5 hpi. Magnified view of neutrophil (right top) and macrophage (right bottom) tracks onto the ventricle. Green and magenta arrowheads indicate neutrophils and macrophages tracked to the ventricle respectively for 30 min from 9.5 hpi. (E) LSFM image (left) and surface render (right) of a Tg(myl7:GFP;mpx:mCherry) injured heart and recruited neutrophils at 6 hpi. (F) LSFM image (left) and surface render (right) of a Tg(myl7:GFP;mpeg1:mCherry) injured heart and recruited macrophages at 6 hpi. White arrowheads indicate recruited immune cells on the lesioned myocardium. (G) Ventricular recruited neutrophil and macrophage speed (top) and meandering index (distance traveled/displacement) (bottom) in heart lasered and uninjured larvae. Average cell behaviors are plotted per larva, n = 5 cells tracked per larva and n = 6 larvae per group. Error bars, SEM. One-way ANOVA and Tukey post hoc test performed for comparisons between mean behavioral values for each larva where ** p < 0.01, *** p < 0.001, and ****p < 0.0001. (H) LSFM image of a Tg(mpx:GFP;mpeg1:mCherry) injured ventricle displaying neutrophils and macrophages at 10 hpi. Arrow indicates a neutrophil and macrophage near the wound (top). LSFM z-plane image of the indicated neutrophil and macrophage. Arrow indicated at the same position (bottom). (I) LSFM image of a Tg(mpx:GFP;mpeg1:mCherry) injured ventricle displaying neutrophils and macrophages at 18 hpi. Arrow indicates a cell co-expressing mpx:GFP and mpeg:mCherry on the wounded ventricle (top and bottom). Arrowheads indicate the injury site. Outline of ventricle is indicated with a dashed line. All fluorescence images were acquired in 3D using LSFM and displayed as MIPs unless stated otherwise. All scale bar = 50 μm, unless stated otherwise. Ba, bulbus arteriosus; Aa, aortic arches; V, ventricle; A, atrium; Vc, venous cavernous.

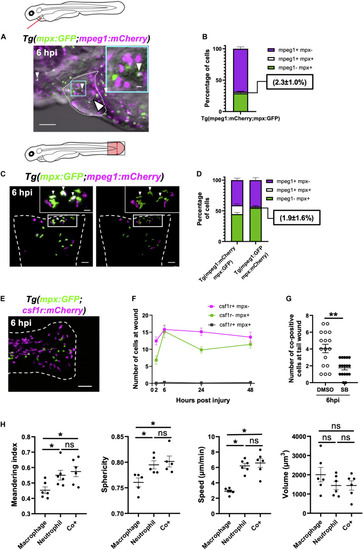
Immune cells co-positive for mpeg1 and mpx expression are neutrophils not macrophages. (A) Epifluorescence timelapse still overlaid on a brightfield image displaying a heart lasered Tg(mpx:GFP;mpeg1:mCherry) larva at 6 hpi with neutrophils (green), macrophages (magenta) and co-positive cells (white). White dotted line, pericardial region; cyan square, magnified region; small arrowheads, co-positive cells; and the large arrowhead, injury site. Scale bar = 100 μm. (B) Percentage of mpeg1:mCherry+ mpx:GFP-, mpeg1:mCherry+ mpx:GFP+ and mpeg1:mCherry-mpx:GFP+ cell populations on the injured ventricle at 6 hpi, n = 31 larvae, experimental n = 3. (C) LSFM 3D images of a transected tail fin at 6 hpi from a Tg(mpx:GFP;mpeg1:mCherry) larva displayed as a MIP (left) and surface render (right) where mpx:GFP signal is colored green and mpeg1:mCherry signal in magenta. Arrowheads, co-positive cells; dashed line, wound edge; and white boxes, magnified panels. Scale bar = 50 μm for main panel and 20 μm for the magnified panel. (D) Percentage of mpeg1:mCherry+ mpx: GFP-, mpeg1:mCherry+ mpx:GFP+ and mpeg1:mCherry-mpx:GFP+ cell populations at the tail wound of Tg(mpx:GFP;mpeg1:mCherry) and Tg(mpx:mCherry;mpeg1:GFP) larvae at 6 hpi, n = 24 larvae, experimental n = 3. (E) Epifluorescence image of a transected tail fin at 6 hpi from a Tg(mpx:GFP;csf1r:gal4;UAS:mCherry-NTR) [abbreviated to Tg(mpx:GFP;csf1r:mCherry)] larva, showing a lack of co-expressing cells. Scale bar = 100 μm. (F) Number of csf1r:NTR-mCherry+ mpx: GFP-, csf1r:NTR-mCherry-mpx:GFP+ and csf1r:NTR-mCherry+ mpx:GFP+ cells at the tail transection wound at 2, 6, 24, and 48 hpi, n = 16 larvae, experimental n = 3. (G) Number of mpx:GFP+ mpeg1:mCherry+ co-positive cells at the tail transection wound at 6 hpi following treatment with Cxcr1/2 antagonist SB225002 (5 μM) or DMSO (0.1%) vehicle, n = 17 larvae, experimental n = 3. Comparison between treatments was conducted using a t-test where ** p < 0.01. (H) Graphs comparing macrophages, neutrophils and co-positive cells on the basis of meandering index, sphericity, speed and volume derived from 3D analysis of LSFM timelapses from transected Tg(mpx:GFP;mpeg1:mCherry) tail fins between 1–2 hpi. Comparisons between cell types was performed by One-way ANOVA followed by a post hoc two-stage step-up method of Benjamini, Krieger and Yekutieli FDR correction, n = 6 larvae analyzed per group where * p < 0.05, ns, non-significant. Error bars, SEM for all graphs.

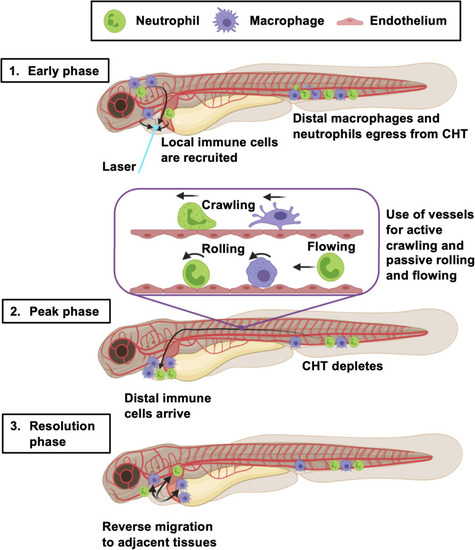
Summary of the larval zebrafish immune response to heart injury. Following laser heart injury in the early phase (0–2 hpi), immune cells resident to nearby pericardial tissues are recruited to the ventricle. At the same time, distal neutrophils and macrophages begin to egress from the CHT into the vascular system. Distal macrophages and neutrophils subsequently utilize blood and lymphatic vessels to migrate to the injured heart, joining locally recruited immune cells during the peak phase (6–24 hpi). The majority of these cells actively crawl along the abluminal surface of vessels, but some also roll and flow along the inside of vessels. The resolution phase is characterized by reverse migration of immune cells to adjacent tissues (> 6 hpi). Created with Biorender.com.

Acknowledgments
This image is the copyrighted work of the attributed author or publisher, and ZFIN has permission only to display this image to its users. Additional permissions should be obtained from the applicable author or publisher of the image. Full text @ Front Cell Dev Biol