IMAGE

FIGURE 4

ID
ZDB-IMAGE-201121-88
Source
Figures for Kaveh et al., 2020
Image
Figure Caption

FIGURE 4

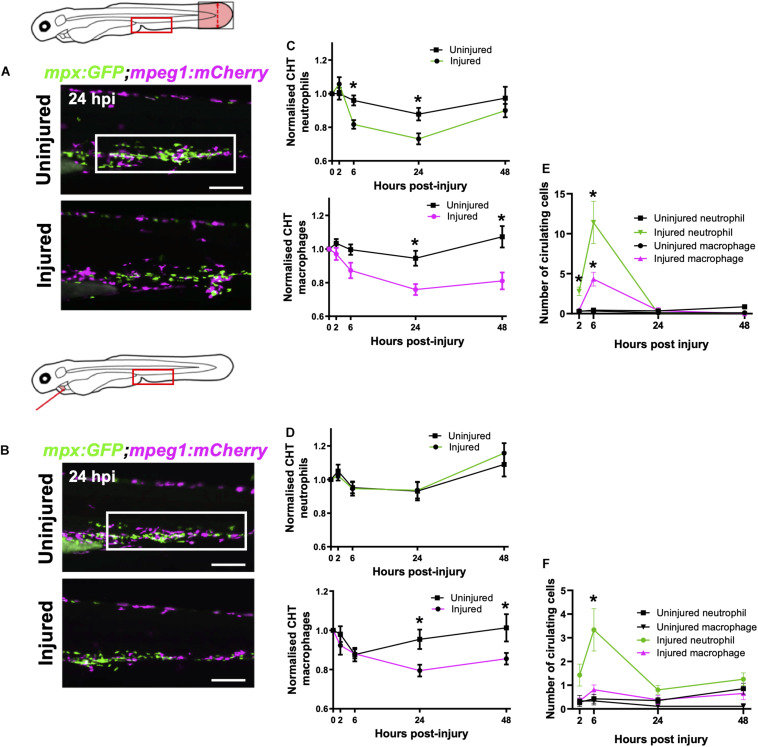
Macrophages are mobilized from the CHT and neutrophils are mobilized into peripheral blood following tail and heart injury. (A,B) Epifluorescence images of Tg(mpx:GFP;mpeg1:mCherry) larval caudal hematopoietic tissue (CHT) at 24 hpi (macrophages, magenta and neutrophils, green) following tail transection (A) and laser heart injury (B). White boxes, area of quantification. Scale bar = 200 μm. (C,D) Total CHT neutrophil and macrophage cell area based on normalized fluorescence using Tg(mpx:GFP;mpeg1:mCherry) larvae, n = 19 larvae, experimental n = 3. Values at each timepoint, cell type (neutrophil and macrophage) and injury model (heart laser and tail transection) are indicated. (E) Numbers of neutrophils and macrophages in the circulatory system following tail transection, n = 16 larvae, experimental n = 3. (F) Numbers of neutrophils and macrophages in the circulatory system following heart laser injury, n = 16 larvae, experimental n = 3. For all graphs, error bars, SEM and comparisons between uninjured, transected or laser injured groups was performed by Two-way ANOVA followed by Sidaks multiple comparison test where * p < 0.05.

Acknowledgments
This image is the copyrighted work of the attributed author or publisher, and ZFIN has permission only to display this image to its users. Additional permissions should be obtained from the applicable author or publisher of the image. Full text @ Front Cell Dev Biol