IMAGE

FIGURE 7

ID
ZDB-IMAGE-201121-92
Source
Figures for Kaveh et al., 2020
Image
Figure Caption

FIGURE 7

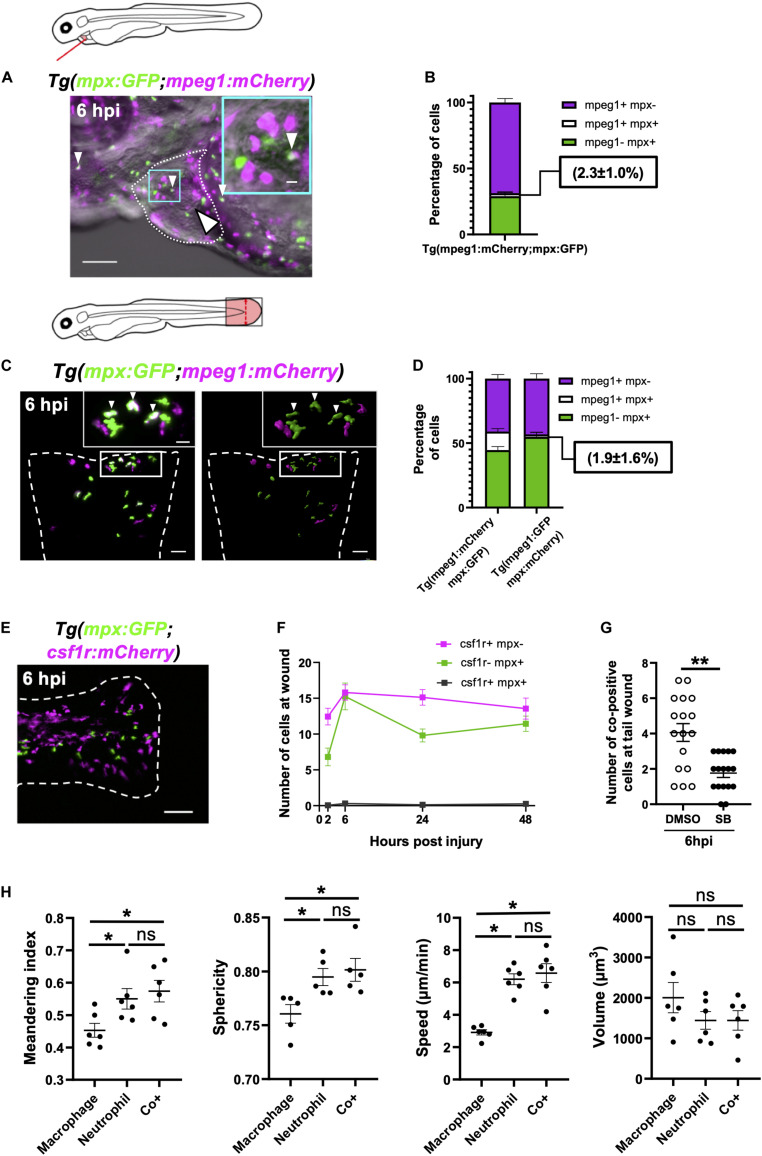
Immune cells co-positive for mpeg1 and mpx expression are neutrophils not macrophages. (A) Epifluorescence timelapse still overlaid on a brightfield image displaying a heart lasered Tg(mpx:GFP;mpeg1:mCherry) larva at 6 hpi with neutrophils (green), macrophages (magenta) and co-positive cells (white). White dotted line, pericardial region; cyan square, magnified region; small arrowheads, co-positive cells; and the large arrowhead, injury site. Scale bar = 100 μm. (B) Percentage of mpeg1:mCherry+ mpx:GFP-, mpeg1:mCherry+ mpx:GFP+ and mpeg1:mCherry-mpx:GFP+ cell populations on the injured ventricle at 6 hpi, n = 31 larvae, experimental n = 3. (C) LSFM 3D images of a transected tail fin at 6 hpi from a Tg(mpx:GFP;mpeg1:mCherry) larva displayed as a MIP (left) and surface render (right) where mpx:GFP signal is colored green and mpeg1:mCherry signal in magenta. Arrowheads, co-positive cells; dashed line, wound edge; and white boxes, magnified panels. Scale bar = 50 μm for main panel and 20 μm for the magnified panel. (D) Percentage of mpeg1:mCherry+ mpx: GFP-, mpeg1:mCherry+ mpx:GFP+ and mpeg1:mCherry-mpx:GFP+ cell populations at the tail wound of Tg(mpx:GFP;mpeg1:mCherry) and Tg(mpx:mCherry;mpeg1:GFP) larvae at 6 hpi, n = 24 larvae, experimental n = 3. (E) Epifluorescence image of a transected tail fin at 6 hpi from a Tg(mpx:GFP;csf1r:gal4;UAS:mCherry-NTR) [abbreviated to Tg(mpx:GFP;csf1r:mCherry)] larva, showing a lack of co-expressing cells. Scale bar = 100 μm. (F) Number of csf1r:NTR-mCherry+ mpx: GFP-, csf1r:NTR-mCherry-mpx:GFP+ and csf1r:NTR-mCherry+ mpx:GFP+ cells at the tail transection wound at 2, 6, 24, and 48 hpi, n = 16 larvae, experimental n = 3. (G) Number of mpx:GFP+ mpeg1:mCherry+ co-positive cells at the tail transection wound at 6 hpi following treatment with Cxcr1/2 antagonist SB225002 (5 μM) or DMSO (0.1%) vehicle, n = 17 larvae, experimental n = 3. Comparison between treatments was conducted using a t-test where ** p < 0.01. (H) Graphs comparing macrophages, neutrophils and co-positive cells on the basis of meandering index, sphericity, speed and volume derived from 3D analysis of LSFM timelapses from transected Tg(mpx:GFP;mpeg1:mCherry) tail fins between 1–2 hpi. Comparisons between cell types was performed by One-way ANOVA followed by a post hoc two-stage step-up method of Benjamini, Krieger and Yekutieli FDR correction, n = 6 larvae analyzed per group where * p < 0.05, ns, non-significant. Error bars, SEM for all graphs.

Acknowledgments
This image is the copyrighted work of the attributed author or publisher, and ZFIN has permission only to display this image to its users. Additional permissions should be obtained from the applicable author or publisher of the image. Full text @ Front Cell Dev Biol