IMAGE

FIGURE 6

ID
ZDB-IMAGE-201121-90
Source
Figures for Kaveh et al., 2020
Image
Figure Caption

FIGURE 6

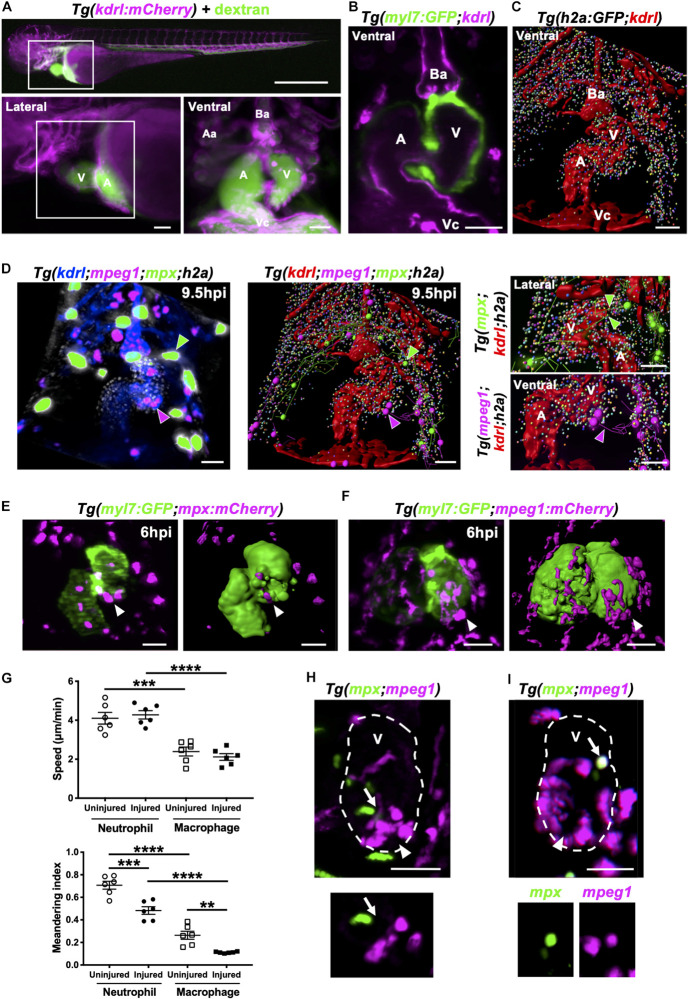
Neutrophils and macrophages migrate onto the ventricle via the pericardium and adopt specific migratory behaviors once on the ventricle following injury. (A) Epifluorescence image of Tg(kdrl:mCherry) larva injected with blue fluorescent 500 kDa dextran (colored green) to analyze the surrounding pericardium for vasculature (white box). Scale bar = 500 μm (top). Magnified epifluorescence image of the surrounding pericardium where white box indicates the nearby heart region (lower left). Magnified 3D LSFM image displaying the hearts vasculature (magenta) containing fluorescent dextran (green) (lower right). (B) LSFM z-plane of Tg(myl7:GFP;kdrl:mCherry) larva displaying the hearts myocardium and endothelium. (C) Surface rendered LSFM z-stack of Tg(h2a:GFP;kdrl:mCherry) larva displaying the hearts vasculature and surrounding pericardium. (D) LSFM fluorescence z-stack differentially color-labeled (left) and surface rendered z-stack (middle and right) of Tg(kdrl:mCherry;mpeg1:mCherry;mpx:GFP;h2a:GFP) larva displaying the heart vasculature (blue or red), pericardium (gray or multi-colored), neutrophils (green) and macrophages (magenta) at 9.5 hpi. Magnified view of neutrophil (right top) and macrophage (right bottom) tracks onto the ventricle. Green and magenta arrowheads indicate neutrophils and macrophages tracked to the ventricle respectively for 30 min from 9.5 hpi. (E) LSFM image (left) and surface render (right) of a Tg(myl7:GFP;mpx:mCherry) injured heart and recruited neutrophils at 6 hpi. (F) LSFM image (left) and surface render (right) of a Tg(myl7:GFP;mpeg1:mCherry) injured heart and recruited macrophages at 6 hpi. White arrowheads indicate recruited immune cells on the lesioned myocardium. (G) Ventricular recruited neutrophil and macrophage speed (top) and meandering index (distance traveled/displacement) (bottom) in heart lasered and uninjured larvae. Average cell behaviors are plotted per larva, n = 5 cells tracked per larva and n = 6 larvae per group. Error bars, SEM. One-way ANOVA and Tukey post hoc test performed for comparisons between mean behavioral values for each larva where ** p < 0.01, *** p < 0.001, and ****p < 0.0001. (H) LSFM image of a Tg(mpx:GFP;mpeg1:mCherry) injured ventricle displaying neutrophils and macrophages at 10 hpi. Arrow indicates a neutrophil and macrophage near the wound (top). LSFM z-plane image of the indicated neutrophil and macrophage. Arrow indicated at the same position (bottom). (I) LSFM image of a Tg(mpx:GFP;mpeg1:mCherry) injured ventricle displaying neutrophils and macrophages at 18 hpi. Arrow indicates a cell co-expressing mpx:GFP and mpeg:mCherry on the wounded ventricle (top and bottom). Arrowheads indicate the injury site. Outline of ventricle is indicated with a dashed line. All fluorescence images were acquired in 3D using LSFM and displayed as MIPs unless stated otherwise. All scale bar = 50 μm, unless stated otherwise. Ba, bulbus arteriosus; Aa, aortic arches; V, ventricle; A, atrium; Vc, venous cavernous.

Acknowledgments
This image is the copyrighted work of the attributed author or publisher, and ZFIN has permission only to display this image to its users. Additional permissions should be obtained from the applicable author or publisher of the image. Full text @ Front Cell Dev Biol