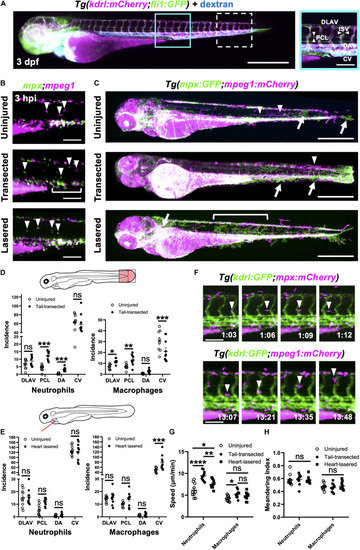
Neutrophils and macrophages utilize blood and lymphatic vessel surfaces for migration following injury. (A) Epifluorescence image of a 3dpf Tg(kdrl:mCherry;fli1:eGFP) whole larva injected with blue fluorescent 500 kDa dextran highlighting the entire cardiovascular network. Cyan box, region used for quantification for (D), which is magnified in the right panel. White dashed box = region used for quantification for (E). The right panel (A magnified) is annotated with vessels monitored for subsequent route use analysis. Left panel scale bar = 500 μm and the right panel scale bar = 100 μm. (B) Epifluorescence images of the peri-cloaca trunk region of Tg(mpx:GFP;mpeg1:mCherry) larvae at 3 hpi in uninjured, tail transected and heart lasered larvae. Neutrophils, green and macrophages, magenta. White bracket indicates a partially emptied CHT and white arrowheads CHT-liberated neutrophils and macrophages. Scale bar = 100 μm. (C) Epifluorescence images superimposed over 4–8 hpi to generate neutrophil (green) and macrophage (magenta) pseudotracks in whole Tg(mpx:GFP;mpeg1:mCherry) uninjured, tail transected and heart lasered larvae. White arrowheads highlight representative macrophage tracks, white arrows highlight representative neutrophil tracks and the white bracket highlights a region of neutrophil ventro-dorsal migration. Scale bar = 500 μm. (D,E) Incidence of vessel use by neutrophils or macrophages in larvae between 1–12 hpi following tail transection (D) or laser heart injury (E). Injured groups were compared to uninjured groups using multiple t-tests with subsequent FDR correction using two stage step-up of Benjamini, Kreiger and Yekutieli, where *p < 0.05, **p < 0.01, and *** p < 0.001, n = 10 larvae analyzed per group. (F) Epifluorescence image sequence from heart lasered larvae showing a neutrophil migrating along the PCL (top) and a macrophage migrating up an ISV (bottom). Hours post injury as indicated. Scale bar = 100 μm. Neutrophil and macrophage speed (G) and meandering index (H) across the trunk 1.5–8 hpi in tail transected, heart lasered or uninjured larvae. Comparisons between groups were carried out using one-way ANOVA followed by Sidak-Holm multiple comparison test where * p < 0.05, ** p < 0.01 and **** p < 0.0001, n = 10 larvae analyzed per group. Error bars for all graphs, SEM; Ns, non-significant; DLAV, dorsal lateral anastomotic vessel; PCL, parachordal lymphatic; DA, dorsal aorta; ISV, intersegmental vessels; and CV, cardinal vein.
|
