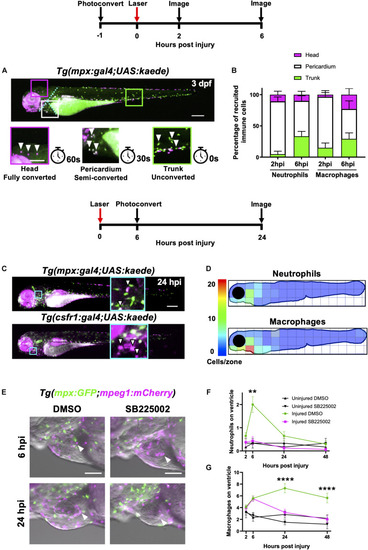
Heart injury recruits local immune cells from the pericardium and head but also cells from distal immune reservoirs. (A) Outline of experimental timeline to trace recruited immune cell tissue-origins. Whole body image of a Tg(mpx:gal4;UAS:kaede) larva where green cells, unconverted kaede; white cells (magenta and green), semi-converted kaede; and magenta cells, fully converted kaede. The larva is partitioned into three conversion areas marked by the cyan dotted line. Photoconversion of each area was achieved using a mercury lamp. Selected regions (boxes) within the three conversion areas are magnified in the lower panels along with the light exposure time for each level of conversion. White arrowheads, cells from each photoconverted region. Pigment in the eye and peripheries of the trunk autofluorescence magenta but are distinguishable from photoconverted cells because they are immobile. Upper panel scale bar = 200 μm and lower panel scale bar = 100 μm. (B) Percentage tissue origin of neutrophils and macrophages recruited to the injured ventricle at 2 and 6 hpi. Error bars = SEM, n = 11–21 larvae, experimental n = 3. (C) Outline of experimental timeline to trace immune cell reverse migration dispersal following heart injury. Whole body image of pericardially photoconverted Tg(mpx:gal4;UAS:kaede) (top panel) and Tg(csf1r:gal4;UAS:kaede) (bottom panel). Examples of converted cells (white arrow heads) are shown in magnified panels (cyan). Unconverted kaede (green), converted kaede (magenta), arrowheads, examples of converted cells, scale bar = 200 μm. (D) Heatmap of a 24 hpi larvae summarizing the dispersal of photoconversion-tracked neutrophils (top panel) and macrophages (bottom panel) following heart injury. Individual zone size = 31000 μm2 and mean cell count normalized per zone, n = 17. (E) Epifluorescence images overlaid on a brightfield image showing neutrophil and macrophage numbers following laser heart injury in Tg(mpx:GFP;mpeg1:mCherry) larvae treated with Cxcr1/2 antagonist SB225002 (5 μM) or DMSO (0.1%) vehicle. Arrowheads, ventricular apex injury site. Scale bar = 100 μm. (F) Neutrophil numbers on the ventricle following laser injury in Tg(mpx:GFP;mpeg1:mCherry) larvae treated with Cxcr1/2 antagonist SB225002 (5 μM) or DMSO (0.1%) vehicle. (G) Macrophage numbers on the ventricle following laser injury in Tg(mpx:GFP;mpeg1:mCherry) larvae treated with Cxcr1/2 antagonist SB225002 (5 μM) or DMSO (0.1%) vehicle. Two-way ANOVA and Tukey post hoc test performed for immune cell comparisons between injured SB225002-treated and injured DMSO vehicle-treated larvae where ** p < 0.01 and **** p < 0.0001. Error bars = SEM, n = 17 larvae, experimental n = 3.
|
