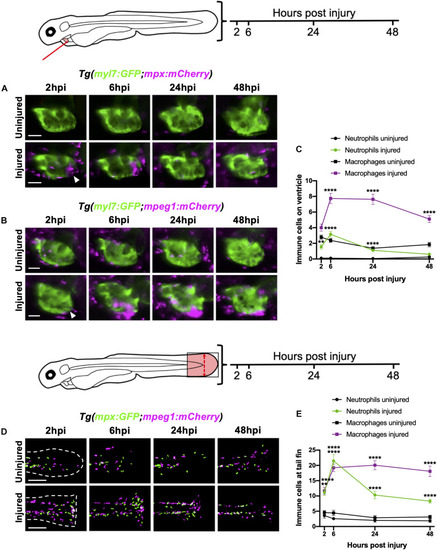
Neutrophils and macrophages display distinct recruitment dynamics during heart injury comparable to tail fin injury. (A) Epifluorescence heart images of uninjured and injured Tg(myl7:GFP;mpx:mCherry) larvae displaying neutrophil accumulation at 2, 6, 24 and 48 hpi, scale bar = 50 μm. (B) Epifluorescence heart images of uninjured and injured Tg(myl7:GFP;mpeg1:mCherry) larvae displaying macrophage accumulation at 2, 6, 24 and 48 hpi, scale bar = 50 μm. Arrowheads indicate ventricular apex injury site. (C) Neutrophil and macrophage numbers on the ventricle at 2, 6, 24 and 48 hpi for uninjured and injured larvae. Error bars = SEM, n = 19 larvae, experimental n = 3. (D) Epifluorescence tail images of uninjured and injured Tg(mpx:GFP;mpeg1:mCherry) larvae displaying neutrophil (green) and macrophage (magenta) accumulation at the timepoints 2, 6, 24 and 48 hpi, scale bar = 60 μm. White dashed line indicates outline of tail fin. (E) Neutrophil and macrophage numbers at the tail fin at 2, 6, 24, and 48 hpi for uninjured and injured larvae. Error bars = SEM, n = 10 larvae for uninjured groups and n = 13 for transected groups, experimental n = 3. Two-way ANOVA and Sidak post hoc test performed for immune cell comparisons between uninjured and injured groups where ** p < 0.001, **** p < 0.0001. Immune cell counts were made from the region of interest (highlighted red) in the corresponding schematics.
|
