
- Title
-
Inter-species variation in monovalent anion substrate selectivity and inhibitor sensitivity in the sodium iodide symporter (NIS)
- Authors
- Concilio, S.C., Zhekova, H.R., Noskov, S.Y., Russell, S.J.
- Source
- Full text @ PLoS One
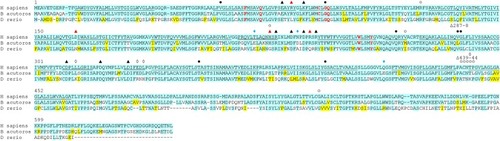
Cyan highlighting indicates absolute conservation to human NIS. Yellow indicates similar residue to human NIS. Underline indicates putative transmembrane domain in human NIS, only TM1-12 are indicated. Closed circles indicate site of a mutation known to cause a transport defect in humans [ |
Species are ordered in ascending evolutionary proximity to humans as determined by TimeTree (pig, mouse, rat, and dog diverged equidistantly) [ |
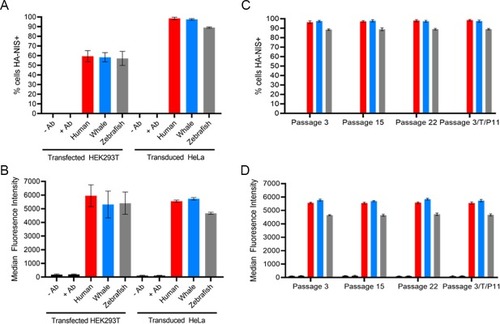
(A) Percentage of cells positively stained with α-HA-AlexaFluor647 antibody; 24-hour post transfection HEK293T cells compared to puromycin selected lentivirally-transduced HeLa cells. (B) Mean fluorescence intensity of HEK293T transfected cells or transduced HeLa cells stained with α-HA-AlexaFluor647 antibody. (C) Percentage of puromycin selected lentivirally transduced HeLa cells over several passages which were stained with α-HA-AlexaFluor647 antibody. 3/T/P11 indicates cells which were frozen at passage 3 post-puromycin selection, thawed, and grown out to passage 11. (D) Median fluorescence intensity of puromycin selected lentivirally transduced HeLa cells over several passages which were stained with α-HA-AlexaFluor647 antibody. Values are averages of triplicate assays with standard deviation. -/+ Ab refers to incubation of antibody with nontransfected/untransduced parental cell line. |
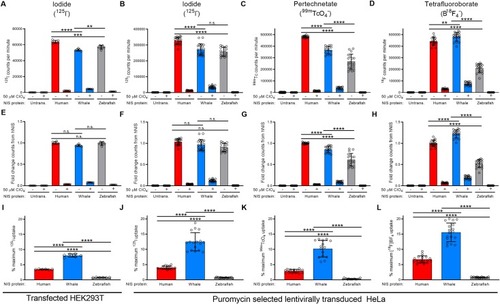
Raw uptake value of (A-B) 125I-, (C) 99mTcO4-, or (D) B18F4- in the absence or presence of 50 μM perchlorate (ClO4) in transfected or transduced cells. (E-H) Uptake of each radioisotope normalized to hNIS uptake via cell surface protein expression. (I-L) The percentage of maximum 125I- uptake activity (uptake at 0 μM ClO4) maintained in the presence of 50 μM perchlorate (ClO4). Values are averages of triplicate assays with standard deviation. n.s. indicates not significant; * indicates p < 0.05; ** indicates p < 0.01; *** indicates p < 0.001; **** indicates p < 0.0001; Untrans. = untransfected or untransduced. |
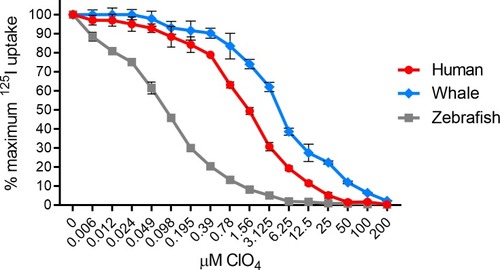
Lentivirally transduced HeLa cells were incubated with 125I- with increasing concentration of perchlorate (ClO4-) for 50 minutes prior to two washes with cold buffer. IC50 values were determined via non-linear regression using the equation setting: {inhibitor} vs. normalized response—variable slope–inhibition in Prism 8. Human NIS ClO4- IC50 = 1.566 μM. Minke whale NIS ClO4- IC50 = 4.566 μM. Zebrafish NIS ClO4- IC50 = 0.081 μM. Values are average of triplicate assays with standard deviation. |
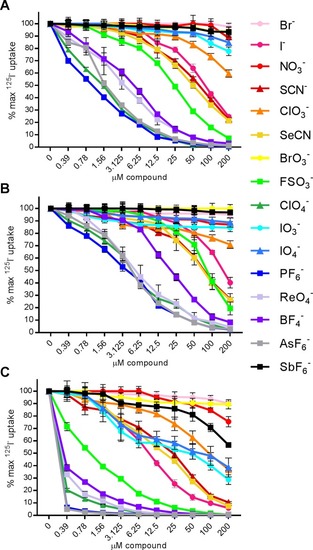
125I- uptake with competitive substrates in HeLa cells transduced with (A) HA-human NIS, (B) HA-whale NIS, or (C) HA-zebrafish NIS. Data shown as the percentage of maximum 125I- uptake activity (0 μM compound) maintained in the presence of increasing concentrations of substrate or inhibitor. Circular markers indicate naturally occurring anions. Triangular markers indicate anions which may occur naturally at low levels or are generated inside the organism. Square markers indicate anions not found naturally. Values are averages of duplicate assays with standard deviation. |
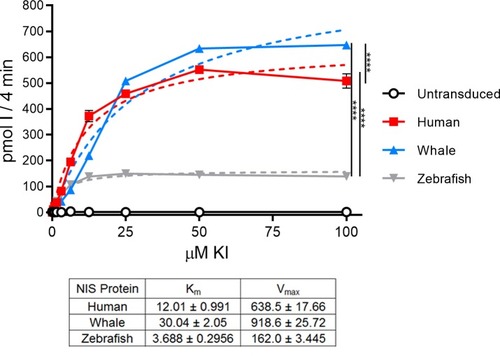
Picomoles of iodide concentrated into HeLa cells lentivirally transduced with HA-NIS proteins after 4 minutes at 37°C. Uptake values were normalized to cell surface protein expression. Solid lines and symbols indicate experimentally derived uptake values. Dashed lines indicate predicted Michaelis-Menten equation curves determined with the least squares (ordinary) fit method in Prism. Km and Vmax values are represented in the table. Units for Km are μM; units for Vmax are pmol I-/4 minutes. Values are averages of triplicate assays with standard error. p-values calculated with experimental values at 50 μM KI; **** indicates p < 0.0001. |
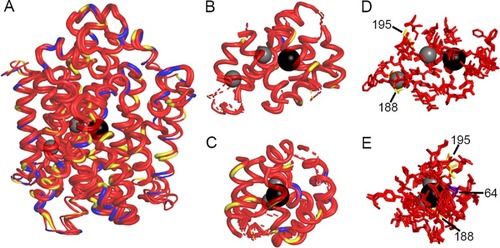
(A) Overlap of hNIS, wNIS, and zNIS. The thickness of the alpha-helices and loops represent per-residue RMSD values calculated between the corresponding residues of hNIS, wNIS, and zNIS with hNIS as a reference. Thick alpha helices and loops signify low RMSD values (regions with high structural similarity). Color coding: red–fully conserved residues between hNIS, wNIS, and zNIS; yellow–substitution with a chemically similar residue in wNIS and zNIS; blue–substitution with non-similar residue; grey spheres–Na+ ions, black sphere–I- ion. (B-C) Two different projections of protein areas within 10Å of Na+ and within 15Å of I-. Dashed lines indicate some or all of residues in the alpha helix are outside the 10/15Å cutoff. (D-E) Two different projections of residues from the ion coordination spheres (within 5Å) identified from MD simulations. The residue numbers of the non-conserved residues are also shown. |