IMAGE

Fig 2

ID
ZDB-IMAGE-200229-21
Source
Figures for Concilio et al., 2020
Image
Figure Caption

Fig 2 Characterization of HA-NIS protein expression and iodide transport.

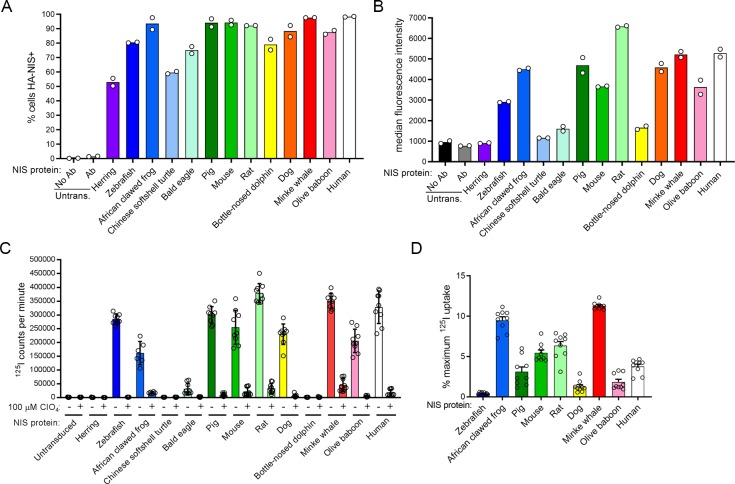
Species are ordered in ascending evolutionary proximity to humans as determined by TimeTree (pig, mouse, rat, and dog diverged equidistantly) [73]. (A) Percentage of 1.25 μg/ml puromycin-selected cells which were positively-stained with α-HA-AlexaFluor647 antibody. (B) Median fluorescence intensity of 1.25 μg/ml puromycin-selected cells which were stained with α-HA-AlexaFluor647 antibody. Values are averages of duplicate assays. (C) Absolute uptake value of each NIS protein in the absence or presence of 100 μM perchlorate (ClO4), which has not been equalized to protein expression. Values are averages of triplicate assays with standard deviation. (D) Percentage of maximum 125I- uptake maintained in the presence of 100 μM perchlorate. Untrans. = untransduced, Ab = antibody.

Acknowledgments
This image is the copyrighted work of the attributed author or publisher, and ZFIN has permission only to display this image to its users. Additional permissions should be obtained from the applicable author or publisher of the image. Full text @ PLoS One