
|
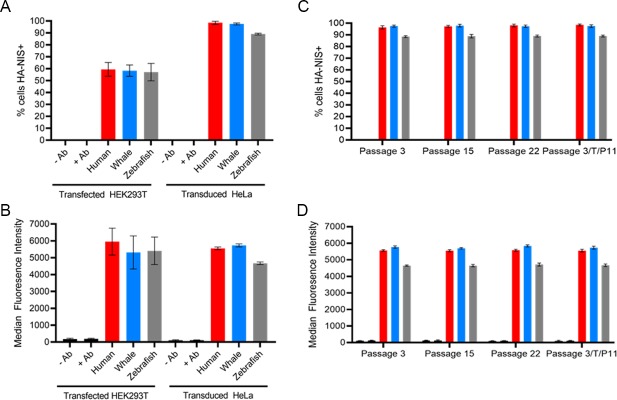
Fig 3
(A) Percentage of cells positively stained with α-HA-AlexaFluor647 antibody; 24-hour post transfection HEK293T cells compared to puromycin selected lentivirally-transduced HeLa cells. (B) Mean fluorescence intensity of HEK293T transfected cells or transduced HeLa cells stained with α-HA-AlexaFluor647 antibody. (C) Percentage of puromycin selected lentivirally transduced HeLa cells over several passages which were stained with α-HA-AlexaFluor647 antibody. 3/T/P11 indicates cells which were frozen at passage 3 post-puromycin selection, thawed, and grown out to passage 11. (D) Median fluorescence intensity of puromycin selected lentivirally transduced HeLa cells over several passages which were stained with α-HA-AlexaFluor647 antibody. Values are averages of triplicate assays with standard deviation. -/+ Ab refers to incubation of antibody with nontransfected/untransduced parental cell line.