Song, S., Lee, J.Y., Ermolenko, L., Mazumder, A., Ji, S., Ryu, H., Kim, H., Kim, D.W., Lee, J.W., Dicato, M., Christov, C., Schnekenburger, M., Cerella, C., Gérard, D., Orlikova-Boyer, B., Al-Mourabit, A., Diederich, M.
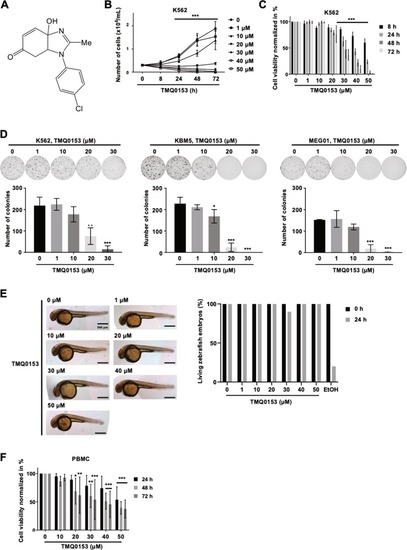
Effect of TMQ0153 on chronic myeloid leukemia cell viability.
a Chemical structure of TMQ0153. b Time- and c dose-dependent effect of TMQ0153 on K562 cell proliferation (left panel) and viability (right panel). d Inhibitory effect of increasing concentrations of TMQ0153 on the colony forming capacities of the indicated CML cell lines. Upper panel: pictures representative of three independent experiments. Lower panel: quantification of the colony numbers. a–d All data represent mean (±S.D.) of three independent experiments. e Acute toxicity assay on zebrafish embryos after 24 h of treatment with increasing concentrations of TMQ0153. Pictures are representative of 10 fishes used for each condition (left panel) and the corresponding quantification of viable embryos (right panel). Ethanol (EtOH, 70%) was used as a positive control for toxicity. f Cytotoxicity of TMQ0153 on human peripheral blood mononuclear cells (PBMCs) by Trypan blue assay after 24, 48, and 72 h of treatment (PBMC data represent the mean (±S.D.) of five independent experiments). Statistical significance was assessed as *p < 0.05, **p < 0.01, ***p < 0.001 compared to untreated cells. Two-way ANOVA (Cell viability); post hoc: Sidak’s test. One-way ANOVA (Colony formation); post hoc: Sidak’s test. Two-way ANOVA (PBMC toxicity); post hoc: Dunnett’s test.
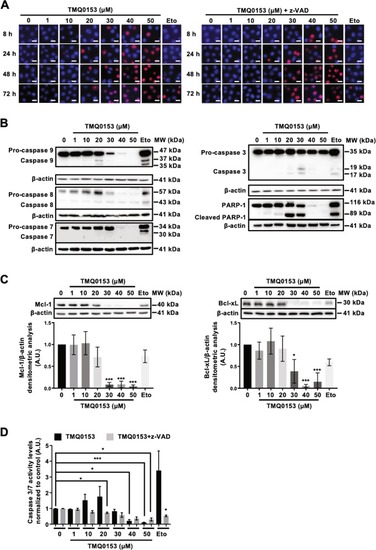
TMQ0153 triggered a concentration-dependent induction of caspase-dependent and independent non-apoptotic cell death in K562 cells.
a–d K562 cells were treated with various concentrations of TMQ0153 in presence or absence of the pan caspase inhibitor carbobenzoxy-valyl-alanyl-aspartyl-[O-methyl]-fluoromethylketone (z-VAD; 50 μM). a After 8, 24, 48, and 72 h of treatment the type of cell death triggered by TMQ0153 was characterized by fluorescence microscopy after Hoechst/propidium iodide (PI) staining. Pictures representative of three independent experiments (top panel). Etoposide (Eto; 100 µM, 24 h) was used as a positive control for apoptosis induction. Scale bar: 25 µM. b Analysis of caspase and poly [ADP-ribose] polymerase (PARP)-1 cleavage by western blot after 24 h of treatment. c Effect of 24 h of treatment on Mcl-1 and Bcl-xL protein expression levels (top panels) and the corresponding densitometric analysis (middle and lower panels). b, c β–actin was used as loading control. d Quantification of caspase-3/7 activity levels after 24 h of treatment. Etoposide (Eto; 100 µM, 24 h) was used as a positive control for apoptosis induction. All pictures are representative of three independent experiments and graphs represent the mean (±S.D.) of three independent experiments. Statistical significance was assessed as *p < 0.05, **p < 0.01, ***p < 0.001 compared to untreated cells. Two-way ANOVA (microscopy analysis); post hoc: Sidak’s test. One-way ANOVA (caspase-3/7 assay); post hoc: Tukey’s test. One-way ANOVA (western blot quantification); post hoc: Dunnett’s test.
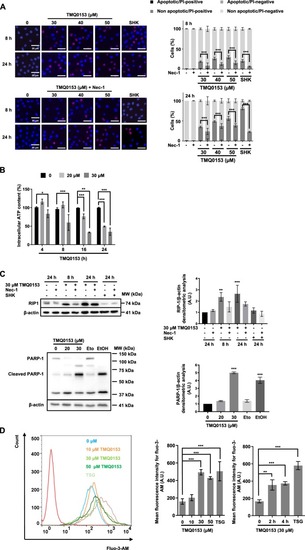
TMQ0153 induced a necrostatin-1-sensitive type of cell death in K562 cells.
a K562 cells were incubated in presence or absence of 60 µM necrostatin (Nec)-1 for 1 h before a treatment with the indicated concentrations of TMQ0153. Shikonin (SHK; 5 µM) was used as a positive control for necrosis induction. a Nuclear morphology analyses by fluorescence microscopy following Hoechst/ propidium iodide (PI) staining after 8 and 24 h of treatment. Pictures representative of three independent experiments (left panels) and the corresponding quantification (right panels). b Measurement of intracellular ATP levels at the indicated concentrations and time points. c Receptor-interacting protein kinase (RIP)1 protein level and PARP-1 cleavage (left panel) were determined by western blotting using C2-10 antibody and the corresponding densitometric analysis (right panel). Shikonin (SHK; 5 µM, 24 h) and necrostatin (Nec)−1 (60 µM, 1 h) were used as a positive control and inhibitor for RIP1. Etoposide (Eto; 100 µM, 24 h) and ethanol (EtOH; 10 %, 2 h) were used as positive controls for apoptotic and necrotic PARP-1 cleavage, respectively. d Cytosolic Ca2+ levels were measured using Fluo-3-AM after 24 h (left panel) and time-dependently measured Ca2+ levels at 30 μM (right panel). Thapsigargin (TSG; 300 nM, 24 h) was used as a positive control for intracellular Ca2+ accumulation. β–actin was used as loading control. All pictures are representative of three independent experiments and all graphs represent the mean (±S.D.) of three independent experiments. Statistical significance was assessed as *p < 0.05, **p < 0.01, ***p < 0.001 for the indicated comparisons. Two-way ANOVA (microscopy analysis, cell viability); post hoc: Sidak’s test. Two-way ANOVA (Cell Titer Glo assay); post hoc; Tukey’s test. One-way ANOVA (intracellular Ca2+ assay); post hoc; Dunnett’s test. One-way ANOVA (western blot quantification); post hoc; Dunnett’s test.
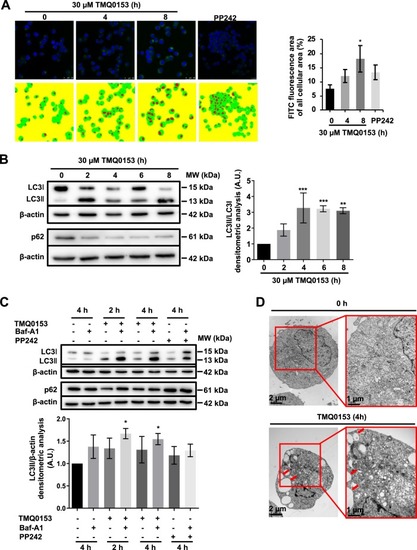
TMQ0153 stimulated autophagy prior to necroptosis.
a Confocal UV microscopy analysis after staining with Cyto-ID (left panel). Representative images of FITC stained images in the 4 groups accompanied by the corresponding pseudocolor masks (red: FITC signal, green: cell area) used for calculation and the corresponding quantification of fluorescence intensity (right panel). Statistical results were compared by Kruskal–Wallis test followed by Conover post-test further adjusted by the Benjamini-Hochberg FDR method. 0 h vs. 4 h and vs 8 h (p < 0.0004 and p < 0.00006, respectively), 4 h vs.8 h (p < 0.002). b Western blot detection of LC3 and p62 protein levels (left panel) and the corresponding densitometric analysis (right panel). c Similar analysis in cells pretreated with 40 nM bafilomycin A1 (baf-A1) for 1 h (upper panel) and the corresponding densitometric analysis (lower panel). 10 µM PP242 for 4 h was used as a positive control for autophagy induction. d Transmission electron microscopy at ×12.000 and ×25.000 magnification: arrows indicate autophagolysosomes. Statistical significance was assessed as *p < 0.05, **p < 0.01, ***p < 0.001 compared to untreated cells unless otherwise specified. One-way ANOVA (western blot quantification); post hoc; Tukey’s test. Two-way ANOVA (mito stress test); post hoc; Sidak’s test.
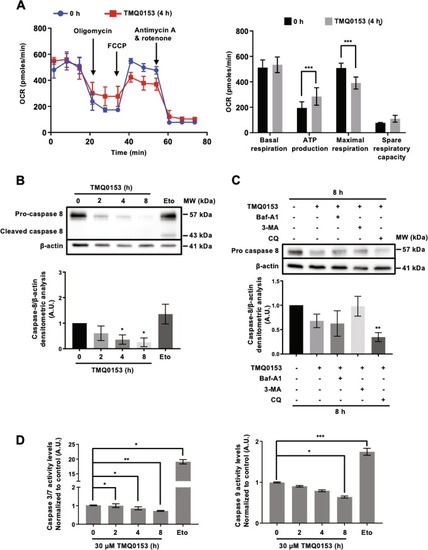
a Oxygen consumption rate (OCR) was measured by Seahorse XFp analyzer. b Caspase 8 analysis by western blot (upper panel) and the corresponding densitometric analysis (lower panel). Etoposide (Eto; 100 µM, 24 h) was used as a positive control for apoptotic caspase cleavage. c Caspase 8 analysis by western blot (upper panel) in the presence or absence of autophagy inhibitors: 40 nM baf-A1, 10 mM, 3-methyladenine (3-MA) and 75 μM chloroquine (CQ) and the corresponding densitometric analysis (lower panel). In western blot analyses, β-actin was used as a loading control. d Quantification of caspases-3/7 (left graph) and -9 activity (right graph) levels at 30 µM of TMQ0153 treatment. Etoposide (Eto; 100 µM, 24 h) was used as a positive control for apoptosis induction. All pictures are representative of three independent experiments and data represent mean (±S.D.) of three independent experiments. Statistical significance was assessed as *p < 0.05, **p < 0.01, ***p < 0.001 compared to untreated cells unless otherwise specified. One-way ANOVA (Caspase-3/7 and -9 assay); post hoc; Tukey’s test. Two-way ANOVA (mito stress test); post hoc; Sidak’s test. One-way ANOVA (western blot quantification); post hoc; Dunnett’s test.
Inhibition of autophagy increases TMQ0153-induced necroptosis.
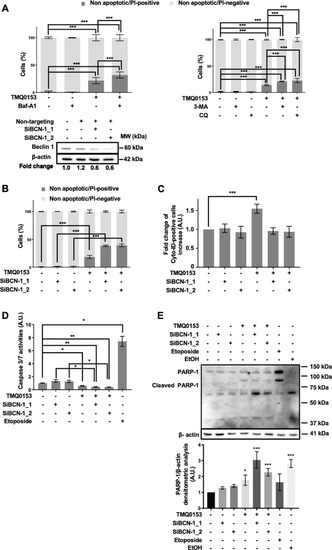
a Effect of autophagy inhibitors (40 nM baf-A1, 10 mM, 3-methyladenine (3-MA) and 75 μM chloroquine (CQ)) on death of K562 cells treated with 30 µM of TMQ0153 assessed by nuclear morphology analysis after 8 h of treatment. b-e K562 cells were transfected with specific small interfering (si)RNAs against beclin 1 [(SiBCN-1), 5 nM SiBCN-1_1 and 10 nM SiBCN-1_2] for 24 h. b Upper panel: effect of siRNA on beclin 1 protein expression level. After quantification of the bands, beclin 1 levels were normalized to β-actin. Lower panel: transfected cells were treated with 30 μM of TMQ0153 and a nuclear morphology analysis was carried out after 8 h of treatment. c-e Effect of siRNA on TMQ0153-induced autophagy quantified by flow cytometry after Cyto-ID staining (c); on caspase-3/7 activity (d), and PARP-1 cleavage using C2-10 antibody (e). Etoposide (Eto; 100 µM, 24 h) and EtOH (10 %, 2 h) were used as positive controls for apoptotic and necrotic PARP-1 cleavage (upper panel) and the corresponding densitometric analysis of necrotic cleavage (lower panel) is visualized. In western blot analyses, β-actin was used as a loading control. All pictures are representative of three independent experiments and data represent mean (±S.D.) of three independent experiments Statistical significance was assessed as *p < 0.05, **p < 0.01, ***p < 0.001 for the indicated comparisons. Two-way ANOVA (nuclear morphology analysis); post hoc; Sidak’s test. One-way ANOVA (Cyto-ID assay); post hoc; Dunnett’s test. One-way ANOVA (caspase 3/7 assay); post hoc; Tukey’s test. One-way ANOVA (western blot quantification); post hoc; Dunnett’s test.
TMQ0153 induced mitochondrial dysfunction and MMP in K562 cells.
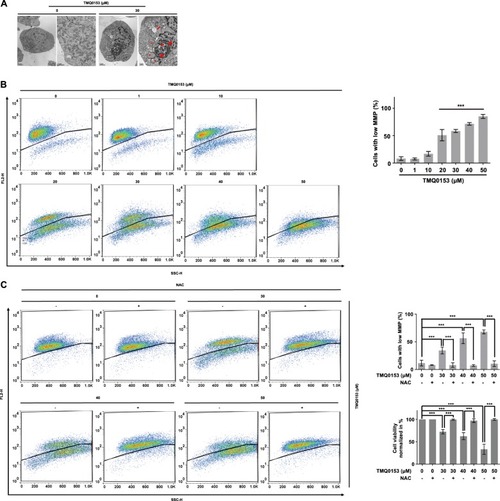
a Cells were treated with TMQ0153 for 8 h and mitochondrial morphology was assessed by TEM at 12.000x and 25.000x magnification. Single arrows and double arrows indicate respectively dilated and giant mitochondria, asterisks indicate autophagophores. b Mitochondrial membrane potential (MMP) analysis in cells treated with increasing concentrations of TMQ0153 for 24 h. The fraction of low MMP presenting cells is depicted. c Cells were pre-incubated for 1 h in presence or absence of 50 mM N-acetyl-L-cysteine (NAC) followed by a treatment with the indicated concentrations of TMQ0153. After 24 h of treatment, MMP (upper panel) cell viability (bottom panel) were assessed by trypan blue assay and flow cytometry, respectively. All pictures are representative of three independent experiments and data represent the mean (±S.D.) of three independent experiments. Statistical significance was assessed as *p < 0.05, **p < 0.01, ***p < 0.001 compared to untreated cells unless otherwise specified. One-way ANOVA (mitochondrial membrane); post hoc; Dunnett’s test. One-way ANOVA (cell viability); post hoc; Tukey’s test.
TMQ0153 triggers necroptotic cell death through decreased GSH levels, involvement of LMP and ROS formation.
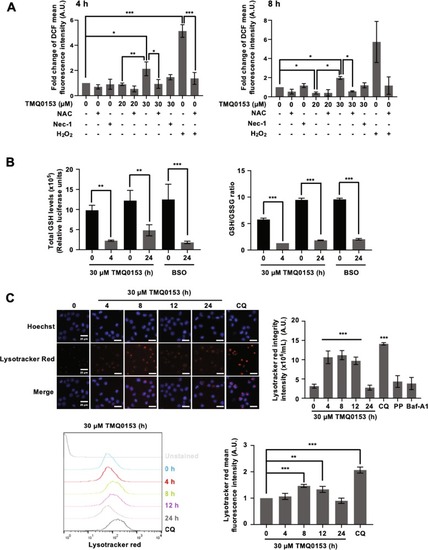
a Cells were pre-incubated for 1 h in presence or absence of 50 mM NAC or 60 µM necrostatin (Nec)−1. After 4 and 8 h of treatment with TMQ0153 at 20 and 30 µM, reactive oxygen species (ROS) levels were measured by flow cytometry following dichlorofluorescein diacetate (H2DCFDA) staining. H2O2 was used as a positive control for ROS induction. b Quantification of total GSH levels (left panel) and GSH (glutathione)/glutathione disulfide (GSSG) ratio (right panel). 50 µM Buthionine sulfoximine (BSO) was used as a positive control for the inhibition of GSH synthesis. c Cells were stained with Hoechst and Lysotracker Red and analyzed by fluorescence microscopy. Lysotracker Red fluorescence intensity was quantified using Image J 1.8.0 software (upper panel). Lysotracker Red intensity was quantified by FACS (bottom panel). Chloroquine (CQ; 75 μM, 4 h), PP242 (PP, 10 μM, 4 h) and baf-A1 (40 nM, 4 h) were used as a positive and negative controls for autophagy inhibition and induction, respectively. All pictures are representative of three independent experiments and data represent the mean (±S.D.) of three independent experiments. Statistical significance was assessed as *p < 0.05, **p < 0.01, ***p < 0.001 compared to untreated cells unless otherwise specified. One-way ANOVA (LMP); post hoc; Dunnett’s test. One-way ANOVA (ROS, GSH assay); post hoc; Tukey’s test.
Acknowledgments
This image is the copyrighted work of the attributed author or publisher, and
ZFIN has permission only to display this image to its users.
Additional permissions should be obtained from the applicable author or publisher of the image.
Full text @ Cell Death Dis.
Your Input Welcome
Thank you for submitting comments. Your input has been emailed to ZFIN curators who may contact you if
additional information is required.
Oops. Something went wrong. Please try again later.