
Fig. 8
- ID
- ZDB-IMAGE-200212-12
- Publication
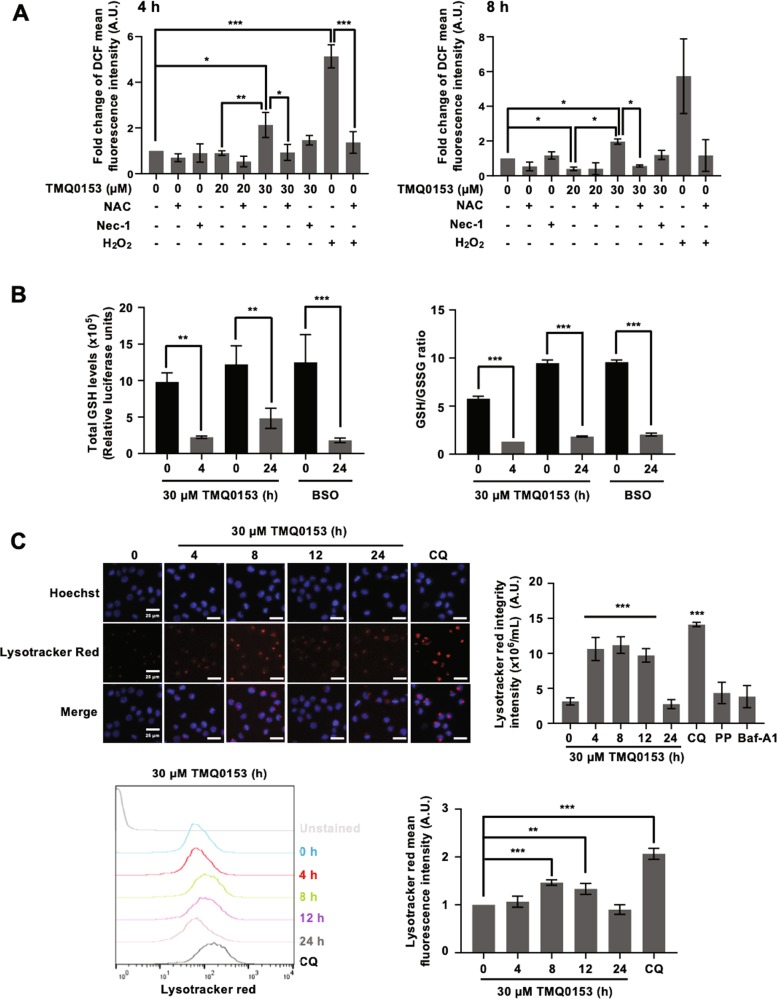
- Song et al., 2020 - Tetrahydrobenzimidazole TMQ0153 triggers apoptosis, autophagy and necroptosis crosstalk in chronic myeloid leukemia
- All Figures
- Figures for Song et al., 2020
|
Fig. 8