IMAGE

Fig. 4

ID
ZDB-IMAGE-200212-7
Source
Figures for Song et al., 2020
Image
Figure Caption

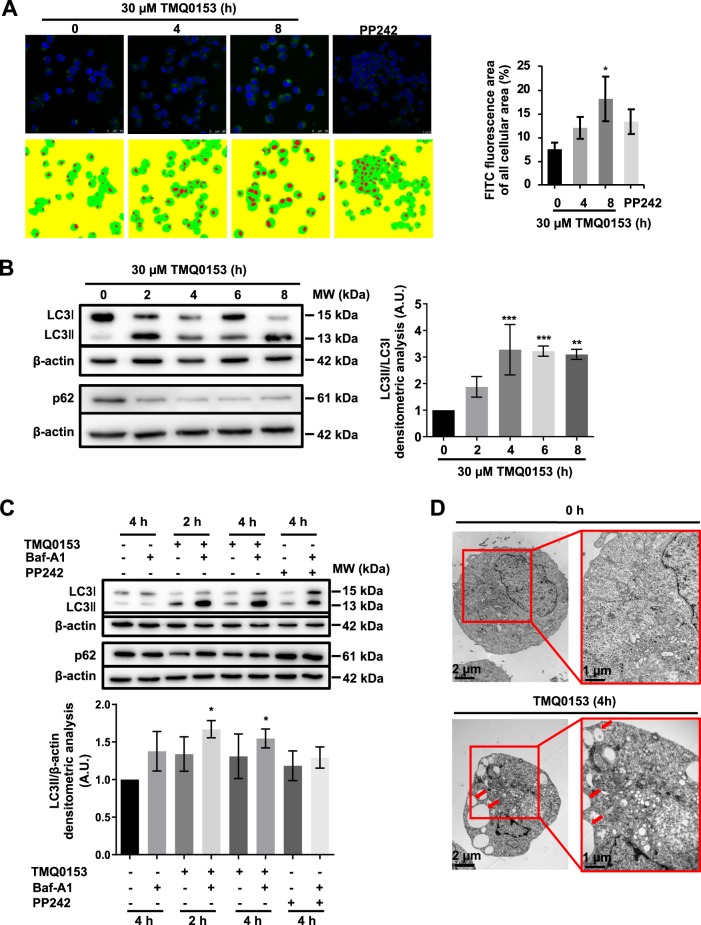
Fig. 4 TMQ0153 stimulated autophagy prior to necroptosis.

a Confocal UV microscopy analysis after staining with Cyto-ID (left panel). Representative images of FITC stained images in the 4 groups accompanied by the corresponding pseudocolor masks (red: FITC signal, green: cell area) used for calculation and the corresponding quantification of fluorescence intensity (right panel). Statistical results were compared by Kruskal–Wallis test followed by Conover post-test further adjusted by the Benjamini-Hochberg FDR method. 0 h vs. 4 h and vs 8 h (p < 0.0004 and p < 0.00006, respectively), 4 h vs.8 h (p < 0.002). b Western blot detection of LC3 and p62 protein levels (left panel) and the corresponding densitometric analysis (right panel). c Similar analysis in cells pretreated with 40 nM bafilomycin A1 (baf-A1) for 1 h (upper panel) and the corresponding densitometric analysis (lower panel). 10 µM PP242 for 4 h was used as a positive control for autophagy induction. d Transmission electron microscopy at ×12.000 and ×25.000 magnification: arrows indicate autophagolysosomes. Statistical significance was assessed as *p < 0.05, **p < 0.01, ***p < 0.001 compared to untreated cells unless otherwise specified. One-way ANOVA (western blot quantification); post hoc; Tukey’s test. Two-way ANOVA (mito stress test); post hoc; Sidak’s test.

Acknowledgments
This image is the copyrighted work of the attributed author or publisher, and ZFIN has permission only to display this image to its users. Additional permissions should be obtained from the applicable author or publisher of the image. Full text @ Cell Death Dis.