
- Title
-
Phenotypical microRNA screen reveals a noncanonical role of CDK2 in regulating neutrophil migration
- Authors
- Hsu, A.Y., Wang, D., Liu, S., Lu, J., Syahirah, R., Bennin, D.A., Huttenlocher, A., Umulis, D.M., Wan, J., Deng, Q.
- Source
- Full text @ Proc. Natl. Acad. Sci. USA
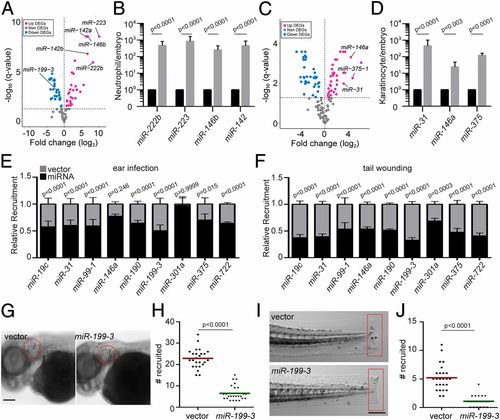
Identification of miRNAs that suppress neutrophil recruitment in vivo. (A) DEGs of miRNAs in zebrafish neutrophils compared with whole embryo. (B) Quantification of selected miRs that were differentially expressed in neutrophils. (C) DEGs of miRNAs in zebrafish epical keratinocytes compared with whole embryo. (D) Quantification of selected miRs that were differentially expressed in keratinocytes. The assay was done with 3 biological repeats, each containing cells sorted from at least 100 larvae per repeat. The result is presented as mean ± SD, using the Holm–Sidak test. (E) Neutrophil recruitment to the infected ear in transgenic lines with neutrophil-specific overexpression of individual miRNAs. Results were normalized to the number of neutrophils recruited in the vector-expressing control lines in each individual experiment (set as a factor of 1). (F) Neutrophil recruitment to tailfin transection sites in transgenic lines as described in C. Representative images (G) and quantification (H) of neutrophils recruited to the infected ear in the vector or miR-199-3–overexpressing zebrafish line are shown. (Scale bar, 100 μm.) Representative images (I) and quantification (J) of neutrophils recruited to tailfin transection sites in the vector or miR-199-3–overexpressing zebrafish line are shown. (Scale bar, 200 μm.) In G–J, the assays were done with at least 2 individual founders with 3 biological repeats, each containing 25 fish per group. The result is presented as mean ± SD, using the Kruskal–Wallis test. |
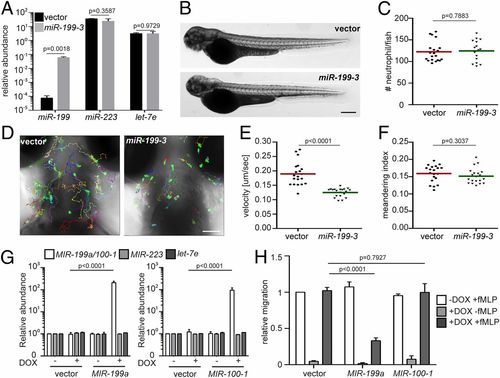
miR-199-3–overexpression reduces neutrophil migration in zebrafish and humans. (A) Quantification of miR-199, miR-223, and let-7e levels in neutrophils sorted from the vector or miR-199-3 zebrafish lines. Neutrophils were isolated from 2 adult kidney marrows from 2 different founders. Results are normalized to u6 expression levels and presented as mean ± SD, using the Holm–Sidak test. Representative images (B) and quantification (C) of total neutrophils in the vector or miR-199-3 zebrafish lines are shown. (Scale bar, 500 μm.) The assays were done with 3 individual founders with 3 biological repeats, each containing 20 fish per group. The result from one representative experiment is shown as mean ± SD, using the Mann–Whitney test. Representative images (D), velocity (E), and meandering index (F) of neutrophil motility in vector or miR-199-3 zebrafish lines are shown. (Scale bar, 100 μm.) Three embryos each from 3 different founders were imaged, and quantification of neutrophils in one representative video is shown. The Kruskal–Wallis test was used. (G) Quantification of MIR-100/199, MIR-233, and LET-7E in dHL-60 cell lines with/without induced expression of the vector control or MIR-100/199. The results from 3 independent experiments are normalized to U6 expression levels and presented as mean ± SD, using the Holm–Sidak test. DOX, doxycycline. (H) Transwell migration of dHL-60 cells with/without induced expression of the vector control, MIR-199, or MIR-100 toward fMLP. Results are presented as mean ± SD from 3 independent experiments and normalized to the vector −DOX + fMLP, using the Kruskal–Wallis test. |
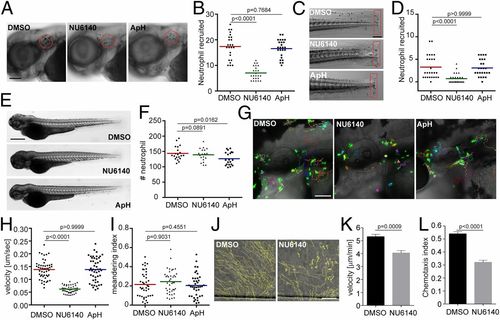
Inhibition of CDK2 reduces neutrophil motility and chemotaxis in zebrafish and humans. Representative images (A) and quantification (B) of neutrophils recruited to the infected ear in zebrafish larvae treated with CDK2 inhibitor (NU6140) or the DNA replication inhibitor aphidicolin + hydroxyurea (ApH) are shown. (Scale bar, 100 μm.) Representative images (C) and quantification (D) of neutrophils recruited to tailfin transection sites in zebrafish larvae treated with NU6140 or ApH are shown. (Scale bar, 200 μm.) Representative images (E) and quantification (F) of total neutrophil number in zebrafish larvae treated with NU6140 or ApH are shown. (Scale bar, 500 μm.) In A–F, assays were done with 3 individual founders with 3 biological repeats, each containing 20 (for motility) or 25 (for neutrophil recruitment) fish per group. The result from one representative experiment is shown as mean ± SD, using the Mann–Whitney test. Representative images (G), velocity (H), and meandering index (I) of neutrophil motility in zebrafish larvae treated with NU6140 or ApH are shown. (Scale bar, 100 μm.) Three embryos each from 3 different founders were imaged, and quantification of neutrophils in one representative video is shown, using the Kruskal–Wallis test. Representative tracks (J), mean velocity (K), and chemotaxis index (L) of primary human neutrophils treated with DMSO or NU6140 (50 μM) migrating toward interleukin-8 are shown. (Scale bar, 100 μm.) Results representative of 3 separate trials are shown. The result is presented as mean ± SEM, using a 2-way paired Welch’s t test. |

Dominant-negative Cdk2 suppresses neutrophil motility and chemotaxis. (A) Schematic of the construct for neutrophil-specific expression of Cdk2 WT or D145N. Representative images (B), velocity (C), and meandering index (D) of neutrophil motility in Cdk2 WT or D145N zebrafish line are shown. (Scale bar, 100 μm.) Three embryos each from 3 different founders were imaged, and quantification of neutrophils in one representative video is shown, using the Kruskal–Wallis test. Representative images (E) and quantification (F) of neutrophil recruitment to the tailfin transection sites in Cdk2 WT or D145N zebrafish line are shown. (Scale bar, 200 μm.) Representative images (G) and quantification (H) of neutrophils migrated to the caudal fin (blue box) normalized to total neutrophils in the trunk (red box) in Cdk2 WT or D145N zebrafish line are shown. (Scale bar, 200 μm.) (I) Simultaneous imaging of the calponin-homology domain of utrophin (Utr-CH)-GFP distribution in neutrophils expressing either WT or D145N Cdk2. Data are representative of more than 3 separate time-lapse videos. (Scale bar, 50 μm.) In E–H, the assays were done with 3 individual founders with 3 biological repeats, each containing 20 (for motility) or 25 (for neutrophil recruitment) fish per group. The result is presented as mean ± SD, using the Mann–Whitney test. |
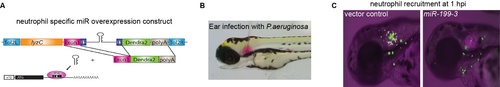
MicroRNA screen experimental design. (A) Each of the miR candidate gene is cloned in the intron of a green fluorescence reporter, driven by a neutrophil specific lyzC promoter. The plasmid is injected into 1-cell stage zebrafish embryos to induce expression of miR in a subset of neutrophils. (B) A representative picture of a bacterial infection which induces neutrophil recruitment to the otic vesicle. (C) Decreased neutrophil recruitment due to the overexpression miR-199-3. An inhibition of 50% neutrophil infiltrating into the ear indicates a positive hit |

Cytotoxicity of CDK2 inhibitor NU6140. (A) Survival of 3 dpf zebrafish embryos treated with indicated doses of NU6140. Survival rates were tallied daily. One representative experiment of three independent experiments (n =20 each group) is shown, Gehan–Breslow–Wilcoxon test. (B, C) Representative images (B) and quantification (C) of neutrophils in the caudal hematopoietic tissue of the 3 dpf embryos from Tg(lyzC:gfp) treated with 100 μM of NU6140 for 3 days. Scale bar: 500 μm. Results are presented as mean ± s.d. of three individual trials, Kruskal–Wallis test. |

The CDK2 inhibitor CTV313 or a pan cdk inhibitor roscovitine reduces neutrophil migration. (A, B) Representative images (A) and quantification (B) of neutrophils recruited to infected ear in zebrafish larva treated with a cdk2 inhibitor (CTV313) or a pan-CDK inhibitor (roscovitine). Scale bar: 100 μm. (C, D) Representative images (C) and quantification (D) of neutrophils recruited to tail fin transection sites in zebrafish larva treated with CTV313 or roscovitine. Scale bar: 200 μm. (E, F) Representative images (E) and quantification (F) of total neutrophil number in zebrafish larva treated with CTV313 or roscovitine. Scale bar: 500 μm. (A-F) Assays were done with at least 3 individual founders with 3 biological repeats each containing 20 (for motility) or 25 (for neutrophil recruitment) fish per group. Result is presented as mean ± s.d., Mann–Whitney test. (G, H) Representative images (G), and quantification of velocity (H) of neutrophils in zebrafish larvae treated with CTV313 or Roscovitine. Scale bar: 100 μm. 3 embryos each from three different founders were imaged and quantification of neutrophils in one representative movie is shown, Kruskal–Wallis test. |

Dynamic changes of neutrophil motility after the addition and washout of CTV313 or roscovitine. (A, B) Representative tracks (A) and quantification of velocity (B) of neutrophils in zebrafish larvae treated with CTV313. (C, D) Representative tracks (C) and quantification of velocity (D) of neutrophils in zebrafish larvae treated with roscovitine. Arrows indicate time of drug introduction and washout. Scale bar: 100 μm. One representative movie and set of respective tracks are shown from 3 individually repeated trials. Results are presented as mean (solid lines) ± s.d. (dashed lines). |
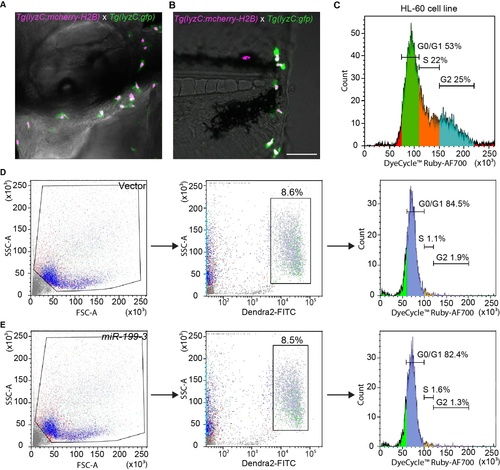
Cell cycle profiling of zebrafish neutrophils. (A) A representative image of 3 dpf embryos from Tg(lyzC:mcherry-H2B) (nucleus magenta label) crossed with Tg(lyzC:gfp) (cytosol green label) at 30 min post ear infection. One representative image of three independent experiments are shown. (B) A representative image of 3 dpf embryos from Tg(lyzC:mcherry-H2B) (nucleus red label) crossed with Tg(lyzC:gfp) (cytosol green label) at 30 min post tail wounding as described in (A). (C) Cell cycle profile of dHL-60 cell line. Cells were separated into G1, S and G2 phased based on the fluorescence intensity of the cell cycle dye. (D) Cell cycle profile (right panel) of neutrophils in adult kidney marrow from the vector control line. Live cells were gated (left panel) and dendra2+ cells were selected for analysis (middle panel). One representative experiment of three biological repeats are shown. (E) Cell cycle profile of neutrophils in adult kidney marrow from the miR-199 line as described in (D). |

Cdk2 D145N inhibits neutrophil motility and chemotaxis and the working model. (A) Representative images and (B) quantification of velocity of neutrophils in 3 dpf zebrafish embryos from the WT or D145N line in a LTB4 bath. Scale bar: 200 μm. (C) Representative images and (D) quantification of velocity of neutrophil motility in 3 dpf zebrafish embryos from the WT or D145N line in the caudal hematopoietic tissue. Scale bar: 200 μm. Assays were performed with at least 3 individual founders with 3 biological repeats each containing at least 3 fish per group. Result is presented as mean ± s.d., Mann–Whitney test. (E) Working model of how miR-199 inhibits neutrophil migration. |
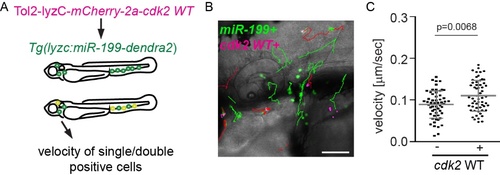
WT Cdk2 partially rescues neutrophil motility defects resulted from miR-199 overexpression. (A) Schematics of experimental design. Embryos from Tg(lyzC:miR-199-Dendra2)pu19 were injected with a plasmid driving miR-199-resistant cdk2 expression in neutrophils, Tol2-lyzC-mCherry-2a-Cdk2 WT . Single (GFP+, miR-199 only) and double positive cells (GFP+mCherry+, miR-199+cdk2+) from the same embryos were tracked. (B, C) Representative images and tracks (B), and quantification of velocity (C) single and double positive cells. Scale bar: 100 μm. Green tracks: miR-199 expression only; Red tracks: miR-199 and cdk2 WT expression. 3 embryos each from three different founders were individual injected, imaged and quantified. Results are presented as mean ± s.d., Mann–Whitney test. |
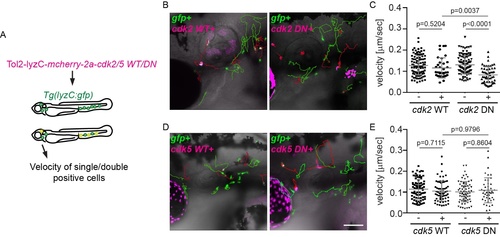
Cdk2, but not Cdk5 DN hinders neutrophil motility in zebrafish. (A) Schematic of experimental design. Embryos from Tg(lyzC:GFP) were injected with a plasmid driving neutrophil specific expression of cdk2 or cdk5 WT/DN. Single (GFP+) and double positive cells (GFP+mCherry+, gfp+cdk2/5 WT/DN+)from the same embryos were tracked. (B, C) Representative images and tracks (B) and quantification of velocity (C) for cdk2 WT/DN expressing neutrophils. (D, E) Representative images and tracks (D) and quantification of velocity (E) for cdk5 WT/DN expressing neutrophils. Scale bar: 100 μm. Quantification was done with at least 3 embryos from three independent injections. Green tracks: gfp only; Red tracks: gfp and cdk double positive. Results are presented as mean ± s.d.. Mann–Whitney test. |