
|
Fig. S6
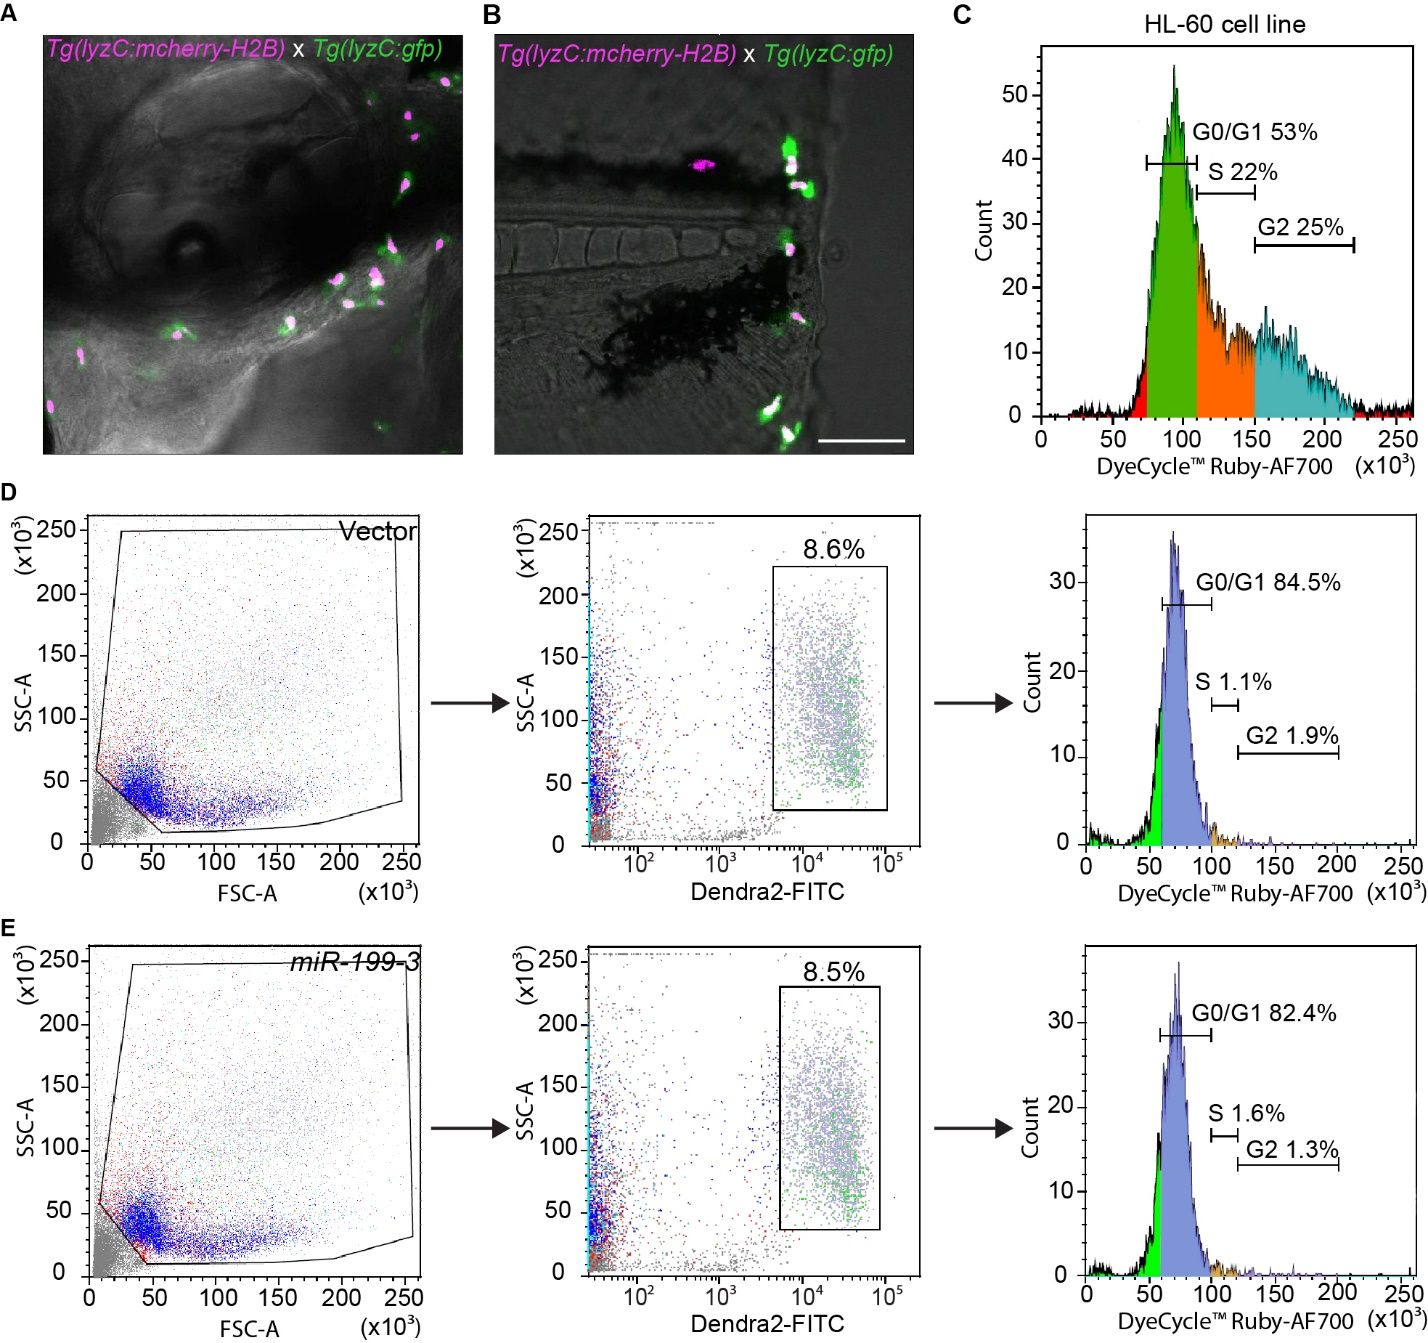
Cell cycle profiling of zebrafish neutrophils.
(A) A representative image of 3 dpf embryos from Tg(lyzC:mcherry-H2B) (nucleus magenta label) crossed with Tg(lyzC:gfp) (cytosol green label) at 30 min post ear infection. One representative image of three independent experiments are shown. (B) A representative image of 3 dpf embryos from Tg(lyzC:mcherry-H2B) (nucleus red label) crossed with Tg(lyzC:gfp) (cytosol green label) at 30 min post tail wounding as described in (A). (C) Cell cycle profile of dHL-60 cell line. Cells were separated into G1, S and G2 phased based on the fluorescence intensity of the cell cycle dye. (D) Cell cycle profile (right panel) of neutrophils in adult kidney marrow from the vector control line. Live cells were gated (left panel) and dendra2+ cells were selected for analysis (middle panel). One representative experiment of three biological repeats are shown. (E) Cell cycle profile of neutrophils in adult kidney marrow from the miR-199 line as described in (D).