
|
Fig. 1
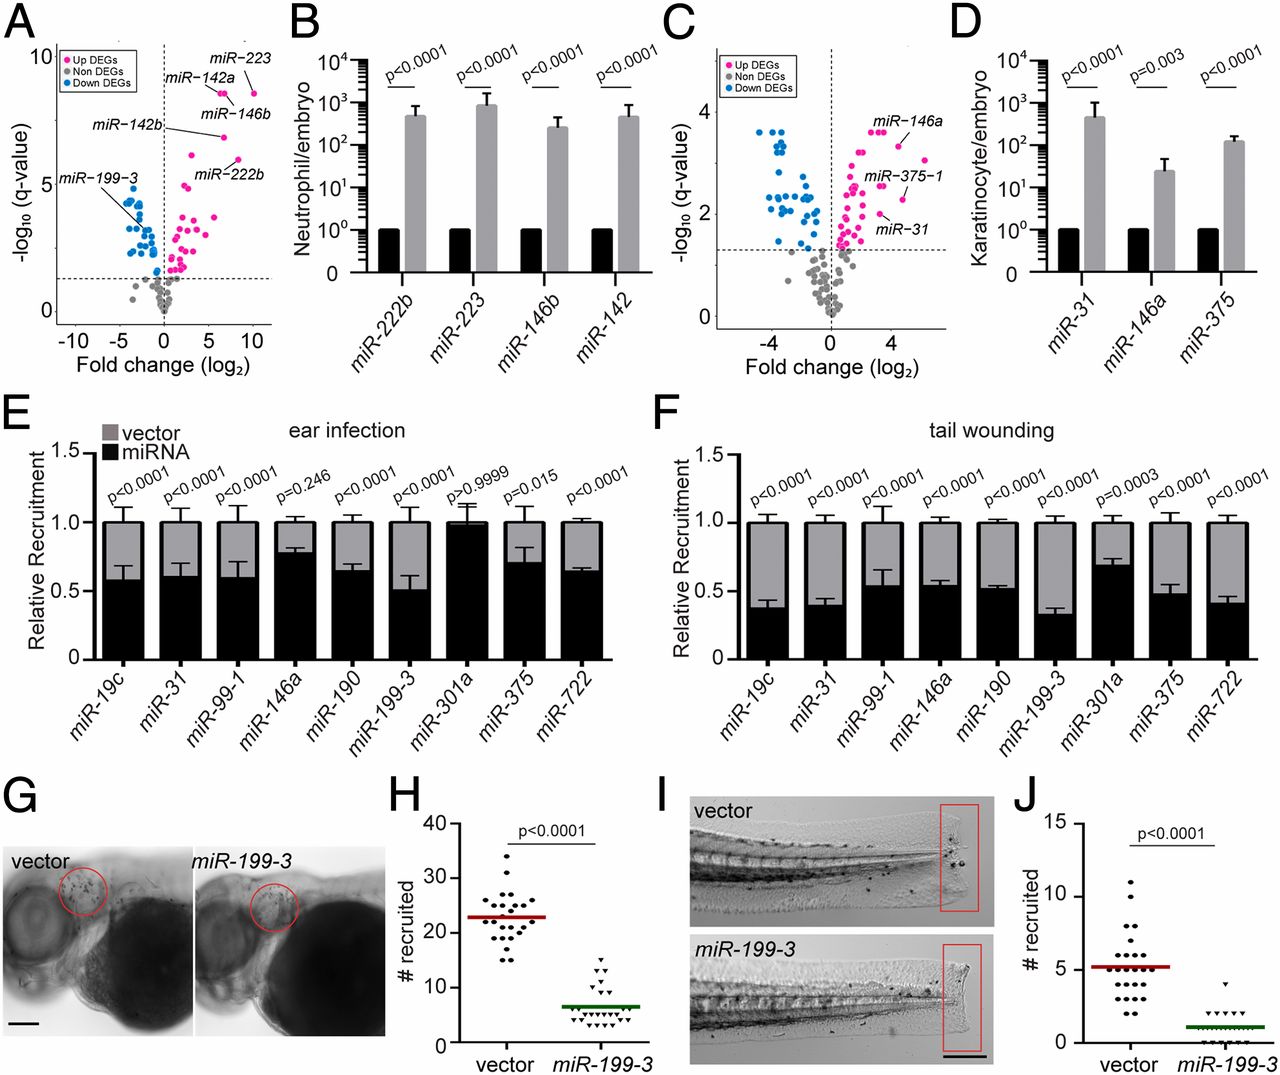
Identification of miRNAs that suppress neutrophil recruitment in vivo. (A) DEGs of miRNAs in zebrafish neutrophils compared with whole embryo. (B) Quantification of selected miRs that were differentially expressed in neutrophils. (C) DEGs of miRNAs in zebrafish epical keratinocytes compared with whole embryo. (D) Quantification of selected miRs that were differentially expressed in keratinocytes. The assay was done with 3 biological repeats, each containing cells sorted from at least 100 larvae per repeat. The result is presented as mean ± SD, using the Holm–Sidak test. (E) Neutrophil recruitment to the infected ear in transgenic lines with neutrophil-specific overexpression of individual miRNAs. Results were normalized to the number of neutrophils recruited in the vector-expressing control lines in each individual experiment (set as a factor of 1). (F) Neutrophil recruitment to tailfin transection sites in transgenic lines as described in C. Representative images (G) and quantification (H) of neutrophils recruited to the infected ear in the vector or miR-199-3–overexpressing zebrafish line are shown. (Scale bar, 100 μm.) Representative images (I) and quantification (J) of neutrophils recruited to tailfin transection sites in the vector or miR-199-3–overexpressing zebrafish line are shown. (Scale bar, 200 μm.) In G–J, the assays were done with at least 2 individual founders with 3 biological repeats, each containing 25 fish per group. The result is presented as mean ± SD, using the Kruskal–Wallis test.