
Image
|
Figure Caption
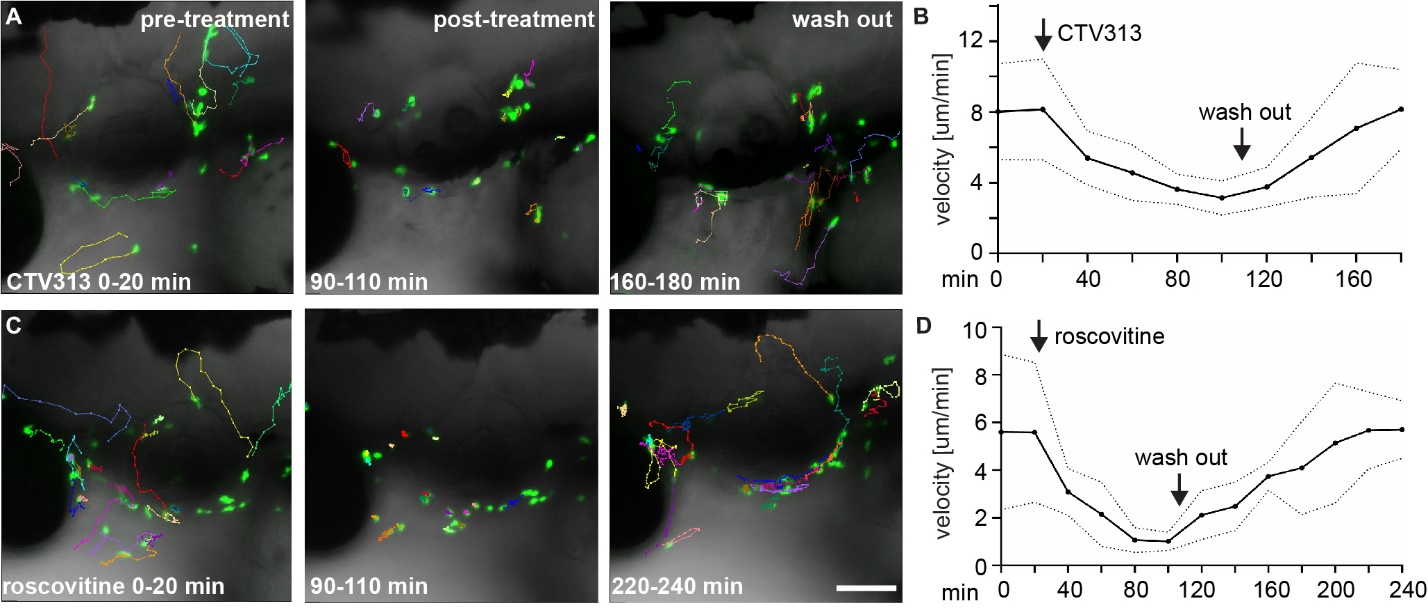
Fig. S5
Dynamic changes of neutrophil motility after the addition and washout of CTV313 or roscovitine.
(A, B) Representative tracks (A) and quantification of velocity (B) of neutrophils in zebrafish larvae treated with CTV313. (C, D) Representative tracks (C) and quantification of velocity (D) of neutrophils in zebrafish larvae treated with roscovitine. Arrows indicate time of drug introduction and washout. Scale bar: 100 μm. One representative movie and set of respective tracks are shown from 3 individually repeated trials. Results are presented as mean (solid lines) ± s.d. (dashed lines).
Acknowledgments
This image is the copyrighted work of the attributed author or publisher, and
ZFIN has permission only to display this image to its users.
Additional permissions should be obtained from the applicable author or publisher of the image.
Full text @ Proc. Natl. Acad. Sci. USA