
|
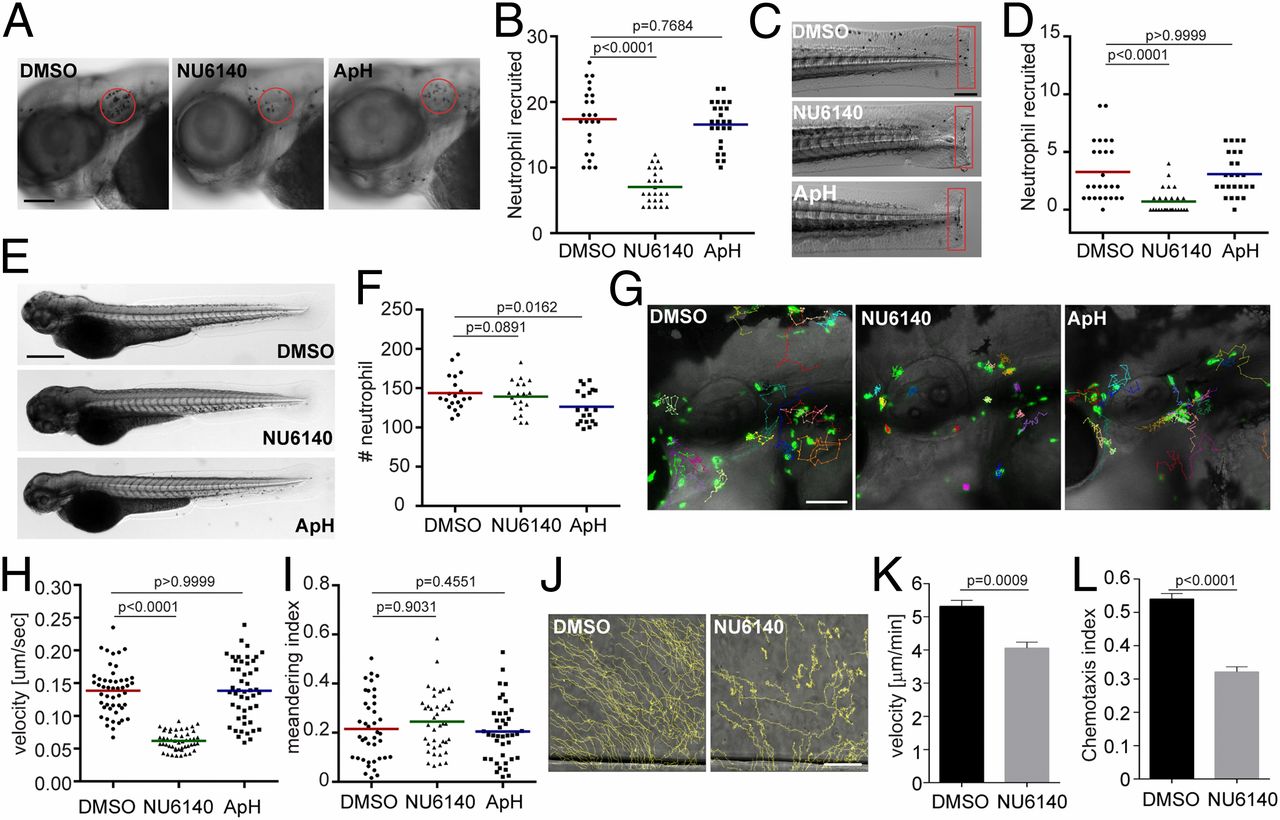
Fig. 4
Inhibition of CDK2 reduces neutrophil motility and chemotaxis in zebrafish and humans. Representative images (A) and quantification (B) of neutrophils recruited to the infected ear in zebrafish larvae treated with CDK2 inhibitor (NU6140) or the DNA replication inhibitor aphidicolin + hydroxyurea (ApH) are shown. (Scale bar, 100 μm.) Representative images (C) and quantification (D) of neutrophils recruited to tailfin transection sites in zebrafish larvae treated with NU6140 or ApH are shown. (Scale bar, 200 μm.) Representative images (E) and quantification (F) of total neutrophil number in zebrafish larvae treated with NU6140 or ApH are shown. (Scale bar, 500 μm.) In A–F, assays were done with 3 individual founders with 3 biological repeats, each containing 20 (for motility) or 25 (for neutrophil recruitment) fish per group. The result from one representative experiment is shown as mean ± SD, using the Mann–Whitney test. Representative images (G), velocity (H), and meandering index (I) of neutrophil motility in zebrafish larvae treated with NU6140 or ApH are shown. (Scale bar, 100 μm.) Three embryos each from 3 different founders were imaged, and quantification of neutrophils in one representative video is shown, using the Kruskal–Wallis test. Representative tracks (J), mean velocity (K), and chemotaxis index (L) of primary human neutrophils treated with DMSO or NU6140 (50 μM) migrating toward interleukin-8 are shown. (Scale bar, 100 μm.) Results representative of 3 separate trials are shown. The result is presented as mean ± SEM, using a 2-way paired Welch’s t test.