
|
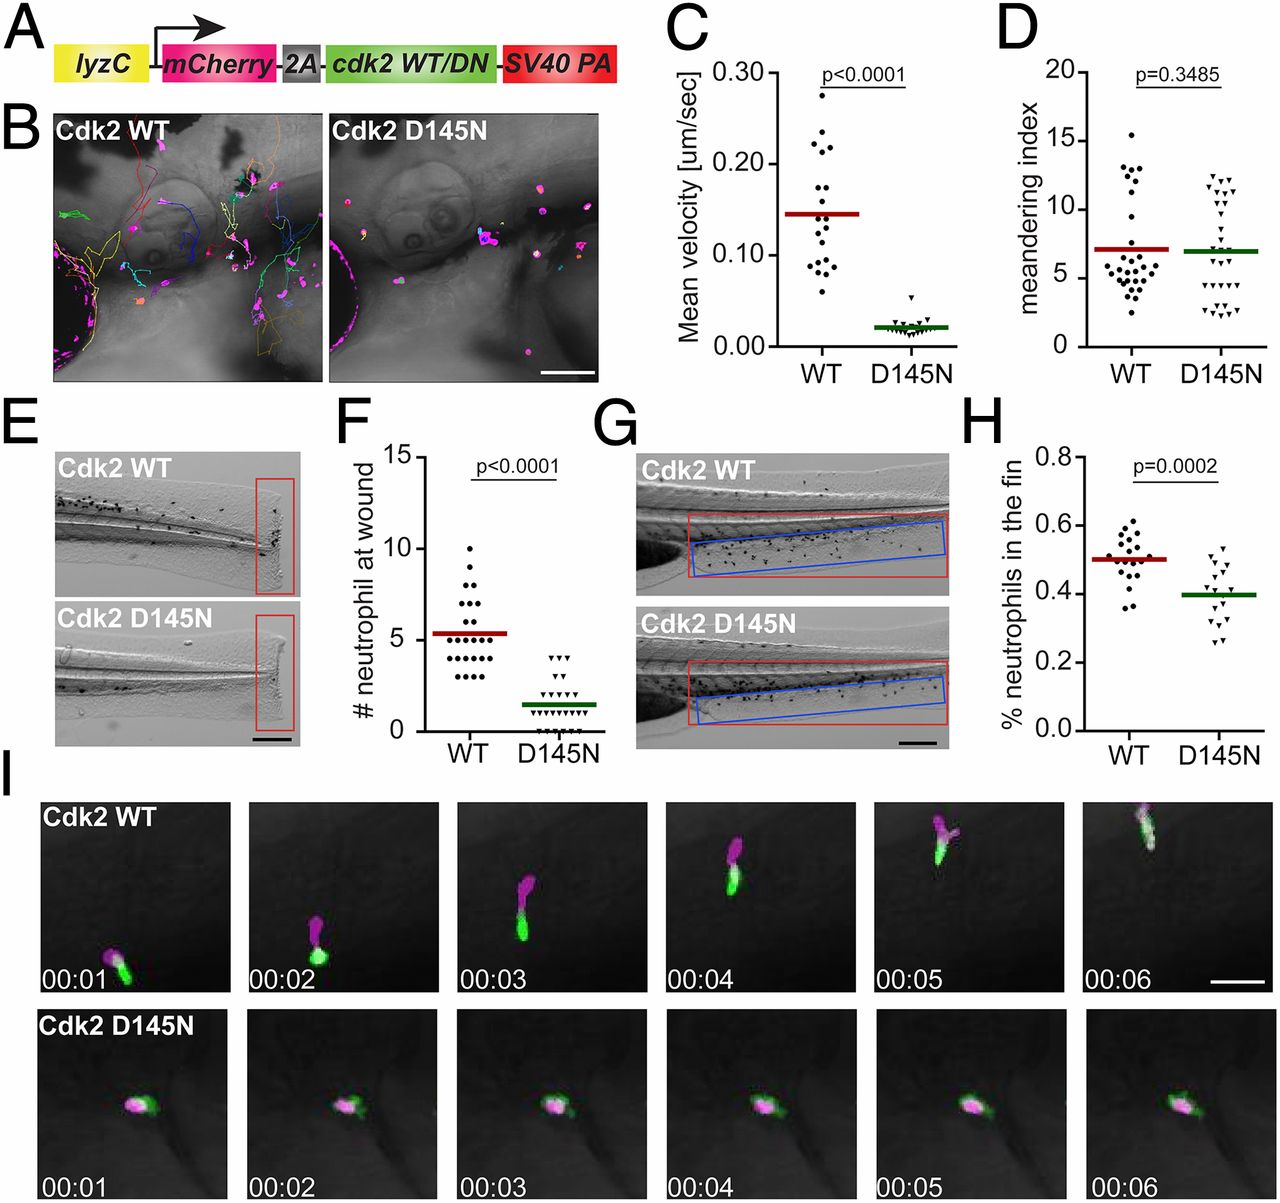
Fig. 5
Dominant-negative Cdk2 suppresses neutrophil motility and chemotaxis. (A) Schematic of the construct for neutrophil-specific expression of Cdk2 WT or D145N. Representative images (B), velocity (C), and meandering index (D) of neutrophil motility in Cdk2 WT or D145N zebrafish line are shown. (Scale bar, 100 μm.) Three embryos each from 3 different founders were imaged, and quantification of neutrophils in one representative video is shown, using the Kruskal–Wallis test. Representative images (E) and quantification (F) of neutrophil recruitment to the tailfin transection sites in Cdk2 WT or D145N zebrafish line are shown. (Scale bar, 200 μm.) Representative images (G) and quantification (H) of neutrophils migrated to the caudal fin (blue box) normalized to total neutrophils in the trunk (red box) in Cdk2 WT or D145N zebrafish line are shown. (Scale bar, 200 μm.) (I) Simultaneous imaging of the calponin-homology domain of utrophin (Utr-CH)-GFP distribution in neutrophils expressing either WT or D145N Cdk2. Data are representative of more than 3 separate time-lapse videos. (Scale bar, 50 μm.) In E–H, the assays were done with 3 individual founders with 3 biological repeats, each containing 20 (for motility) or 25 (for neutrophil recruitment) fish per group. The result is presented as mean ± SD, using the Mann–Whitney test.