
- Title
-
Role of Reelin in cell positioning in the cerebellum and the cerebellum-like structure in zebrafish
- Authors
- Nimura, T., Itoh, T., Hagio, H., Hayashi, T., Di Donato, V., Takeuchi, M., Itoh, T., Inoguchi, F., Sato, Y., Yamamoto, N., Katsuyama, Y., Del Bene, F., Shimizu, T., Hibi, M.
- Source
- Full text @ Dev. Biol.

Aberrant positioning of Purkinje cells (PCs) in adult zebrafish reln, vldlr, and dab1a mutants. (A–J) Sagittal sections of the brain from adult (90–150 dpf) wild-type (WT, A-A″, n= 6), and reln (C–C″, E-E″, n= 5 for relnΔ7/Δ7 and n= 5 for relnΔ28/Δ28), vldlr+13/+13 (G-G″, n= 5), and dab1aΔ14/Δ14(I–I″, n= 8) mutant zebrafish were stained with anti-parvalbumin7 (Pvalb7, magenta) and anti-Vglut1 (green) antibodies. Typical cerebellum images are shown. (B–B″, D-D″, F–F″, H–H″, J-J″) High magnification images of the boxes in A", C", E", G", and I". Ectopic Purkinje cells (PCs) are indicated by arrowheads. Axonal projections of granule cells (GCs) to ectopic PCs are marked by dotted circles. (K) Ectopic PCs. Sagittal sections 14-μm thick were prepared from adult zebrafish WT (n= 7), and relnΔ7/Δ7 (n= 8), vldlr+13/+13 (n= 5), and dab1aΔ14/Δ14 (n= 12) mutant brains. Pvalb7+ PCs in the granule cell layer (GCL) or the Purkinje cell layer (PCL) were counted in every fourth section (14 total sections near the midline of each fish). Average numbers and standard deviations of PCs in the GCL, PCL, or all layers (Total) are shown in the graph. (L) Proportion of PCs in the GCL in WT, and relnΔ7/Δ7, vldlr+13/+13, and dab1aΔ14/Δ14 mutant cerebellum. A greater proportion of the total PCs were located in the GCL in the reln, vldlr, and dab1a mutants than in WT. *p < 0.05; **p < 0.01; ***p< 0.001; ns not significant (Dunnett’s test for K and Dunn’s multiple comparison test for L). Scale bars: 100 μm in A (applies to A-A″, C–C″, E-E″, G-G″, I–I″); 50 μm in B, D, F, H, and J (applies to B–B″, D-D″, F–F″, H–H″ and J-J″, respectively). |
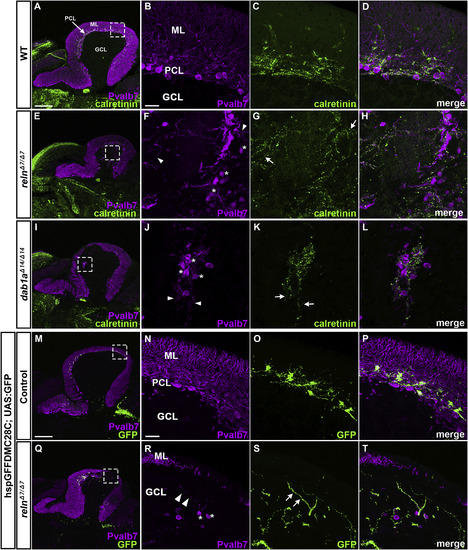
Projection of climbing fibers (CFs) to ectopic PCs in reln and dab1amutants. (A–L) Calretinin-immunoreactive (CR-ir+) axonal projections to PCs. Sagittal sections of adult (92-dpf) WT (A-D, n= 4) and relnΔ7/Δ7mutant (E-L, n= 4) brains were stained with anti-Pvalb7 (magenta) and anti-calretinin antibodies (green). (B-D, F–H, J-L) High magnification images of the boxes in A, E, and I. Typical images are shown. CR-ir+ axons projected to ectopic PCs located in the GCL in reln mutant cerebella, but not in WT cerebella. (M–T) CF projections to ectopic PCs. Sagittal section of adult (96 dpf) hspGFFDMC28C (28C); UAS:GFP fish brains, which express GFP in the CFs (axons of the neurons in the inferior olivary nuclei), harboring WT (control, n= 4) or homozygous reln mutant (relnΔ7/Δ7, n= 4) alleles were stained with anti-Pvalb7 (magenta), and anti-GFP (green) antibodies. GFP+ CFs projected to ectopic PCs located in the GCL in reln mutant cerebella, but not in WT cerebella. Ectopic somata and dendrites of PCs are indicated by asterisks and arrowheads, respectively. CR-ir+ and 28C; UAS:GFP+ axons projecting to the ectopic Purkinje cells are indicated by arrows. The abbreviations are described in the legend for Fig. 1. Scale bars: 200 μm in A (applies to A, E, and I); 20 μm in B (applies to B-D, F–H, J-L); 200 μm in M (applies to M and Q); 20 μm in N (applies to N-P and R-T). |
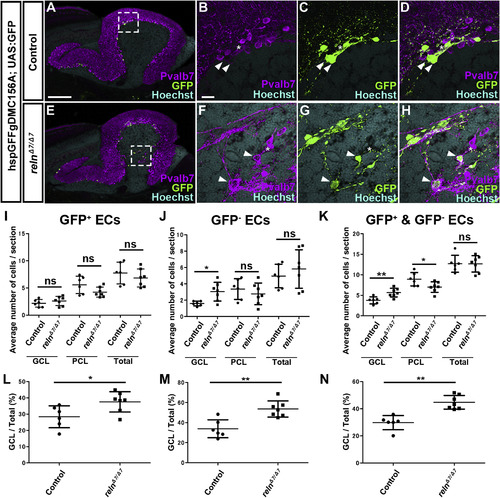
Ectopic eurydendroid cells (ECs) in reln mutants. (A–H) Ectopic ECs in relnΔ7/Δ7 mutants. Sagittal sections of adult (96-dpf) hspGFFgDMC156A; UAS:GFP zebrafish brains, which express GFP in ECs, harboring WT (control, n= 6) or homozygous reln mutant (relnΔ7/Δ7, n= 7) alleles were stained with anti-Pvalb7 (magenta), anti-GFP (green) antibodies, and Hoechst (nucleus, cyan). (B-D, F–H) High magnification images of the boxes in A and E. There are two types of ECs: GFP+(indicated by arrowheads) and GFP− (asterisks) ECs, both of which receive the Pvalb7+ axons of PCs (somata are surrounded by Pvalb7+ axons). Ectopic GFP+ and GFP− ECs were observed in the GCL of the reln mutant cerebellum (E–H). (I–K) GFP+ (I), GFP− (J), and total (J) ECs in the GCL, the PCL, or all layers (Total) of the controls and relnΔ7/Δ7 mutants were counted in every fourth section (18 total sections near the midline in each fish). Average numbers and standard deviations of ECs in the GCL, PCL, or all layers (Total) are shown in graphs. (L–N) Proportion of GFP+ (L), GFP− (M), or total (N) ECs in the GCL in controls and relnΔ7/Δ7 mutants. *p < 0.05; **p< 0.01; ns not significant (Welch’s t-test for GCL in J; Student’s t-test for I, PCL and Total in J, and K; Mann-Whitney test for L-N). Scale bars: 200 μm in A (applies to A and E); 40 μm in B (applies to B-D, F–H). |
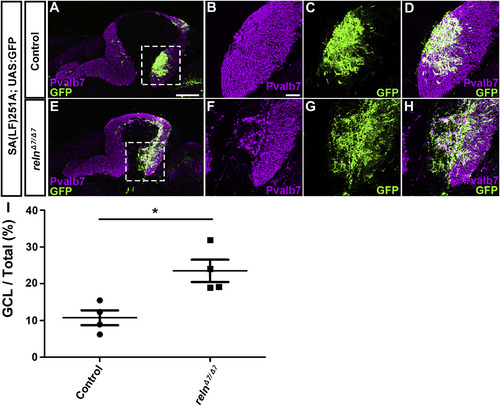
Ectopic Bergmann glial cells (BGs) in reln mutants. (A–H) Aberrant localization of BGs in reln mutants. Sagittal section of adult (96 dpf) SAGFF(LF)251A; UAS:GFP brains, which express GFP in BGs, harboring WT (control, n= 5) or homozygous reln mutant (relnΔ7/Δ7, n= 5) alleles were stained with anti-Pvalb7 (magenta) and anti-GFP (green) antibodies. (B-D, F–H) High magnification images of the boxes in A and E. (I) Ratio of the BG (GFP+) area in the GCL to the total BG area in controls and relnΔ7/Δ7mutants. Fluorescence images were captured of every fourth section (14 total sections in each fish). The GFP+ area in the Pvalb7-negative GCL layer was measured and divided by the total GFP+ area in the cerebellum. *p< 0.05 (Mann-Whitney test). Scale bars: 300 μm in A (applies to A and E); 50 μm in B (applies to B-D and F–H). |
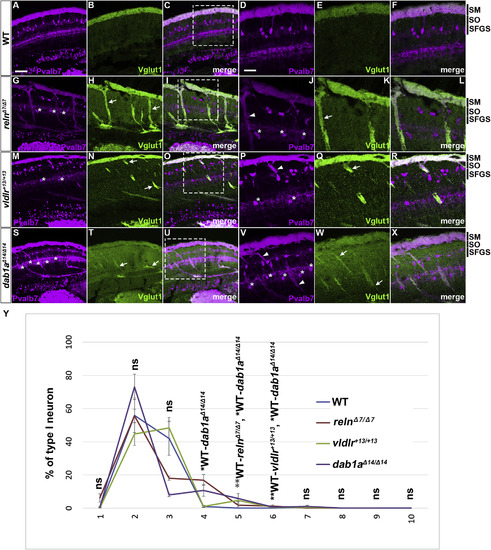
Aberrant positioning of type I neurons in adult zebrafish reln, vldlr, and dab1a mutants. (A–X) Cross sections of the brain from adult (90–150 dpf) WT (A-F, n= 9) and relnΔ7/Δ7 (G-L, n= 5), vldlr+13/+13 (M-R, n= 5), and dab1aΔ14/Δ14 (S-X, n= 4) mutant zebrafish were stained with anti- Pvalb7 (magenta) and anti-Vglut1 (green). Typical tectum images are shown. (D-F, J-L, P-R, V-X) High magnification images of the boxes in C, I, O, and U. Typical images are shown. Pvalb7+ type I neurons were located in a restricted area of the stratum fibrosum et griseum superficiale (SFGS) layer in the tectum in WT (A, D), but were ectopically localized in reln, vldlr, and dab1a mutants (indicated by asterisks in G, J, M, P, S, and V). Dendrites of some type I neurons were misoriented (indicated by arrowheads in J, P, and V). The Vglut1+ axons of granule cells (GCs) in the tectum project to dendrites of type I neurons in the stratum marginale (SM) in WT (B, E). These axons projected to ectopic type I neurons in reln, vldlr, and dab1a mutants (indicated by arrows in H, K, N, Q, T, and W). The stratum opticum (SO) is located between the SM and the SFGS. (Y) Position of type I neurons in WT (n= 9), relnΔ7/Δ7 (n= 4), vldlr+13/+13 (n= 4), and dab1aΔ14/Δ14 (n= 4). The tectum region was divided into ten domains from the pia to ventricle. The positions of the type I neurons were determined by measuring the distance between the pia and the soma of type I neurons. Pvalb7+ cells located in the vicinity of the ventricular zone that had a morphology different from type I neurons were excluded. Average and standard deviation are indicated in the graph. *p < 0.05; **p < 0.01; ***p< 0.001; ns not significant (Dunn’s multiple comparison test). Scale bars: 20 μm in A (applies to A-C, G-I, M-O, and S–U); 40 μm in D (applies to D-F, J-L, P-R, and V-X). |
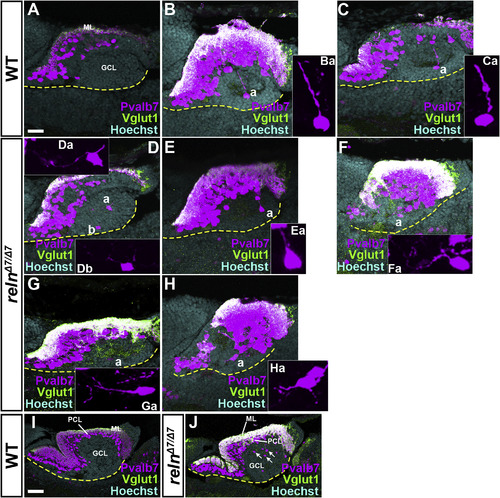
Defects in the migration and polarity of PCs in reln mutants. Sagittal sections of the brain from WT (A-C, n= 4) and relnΔ7/Δ7 (D-H, n= 4) 15-dpf larvae, and from WT (I, n= 3) and relnΔ7/Δ7 (J, n= 3) 30-dpf fish, were stained with anti-Pvalb7 (magenta) and anti-Vglut1 (green) antibodies, and Hoechst (cyan). Typical cerebellum images are shown. The ventral limit of the cerebellum is indicated by a dotted line. (Ba, Ca, Da, Ea, Fa, Ga, Ha) High magnification images of the PCs marked by “a” in B–H. The Pvalb7 and Vglut1-double positive region marks the ML. Migrating PCs were detected in the GCL in WT, and they extended a neurite (primary dendrite) toward the pial side (Ba, Ca, n= 4). Many of the migrating cells extended one or multiple neurites in aberrant directions in the relnΔ7/Δ7mutants (Ea, Fa, Ga, Ha, n= 4). At 30 dpf, most of the PCs had reached the PCL in WT (I), whereas many ectopic PCs were detected in the GCL in relnΔ7/Δ7 mutants (J, n= 3). The abbreviations are described in the legend for Fig. 1. Scale bars: 20 μm in A (applies to A-H); 100 μm in I (applies to I-J). EXPRESSION / LABELING:
PHENOTYPE:
|

Localization of Reln protein in the tectum and the cerebellum. Medial and lateral sagittal sections of the brain from 30-dpf (A–P) and 90-dpf (Q–T) WT and relnΔ7/Δ7 mutant zebrafish were stained with anti-Reln (magenta), anti-Vglut1 (green), and Hoechst (cyan). Three fish for 30-dpf and one fish for 90-dpf WT or relnΔ7/Δ7 mutant fish were analyzed. Typical images are shown. (E-H, M-P) High magnification images of the boxes in C, D, K, and L. In WT, Reln protein was detected strongly in the SM and relatively weakly in the SO in the TeO. Reln was also detected strongly in the ML in the Cb. Weak Reln signals were also detected in the GCs in the TL and the GCL. These signals were absent in relnΔ7/Δ7mutants. CC, crista cerebellaris. The other abbreviations are described in the legend for Fig. 1. Scale bars: 100 μm in A (applies to A-D, I-L); 50 μm in E (applies to E-H, M-P); 200 μm in Q (applies to Q-T). EXPRESSION / LABELING:
PHENOTYPE:
|
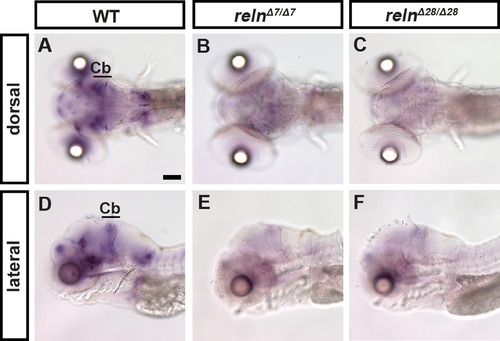
reln transcripts are severely decreased in reln mutants. Expression of reln in 5-dpf WT (A, D, n= 2), relnΔ7/Δ7 (B, E, n= 2), and relnΔ28/Δ28 (C, F, n= 2) larvae was analyzed by whole-mount in situ hybridization. Note that the reln expression was severely decreased in the reln mutants. Cb, cerebellum. Scale bars: 100 μm in A. |
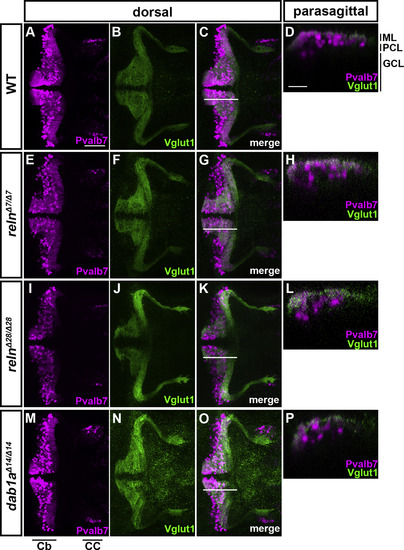
Cerebellum development is not affected in reln or dab1a mutant early-stage larvae. WT (A-D, n= 8), relnΔ7/Δ7 (E-H, n= 5), relnΔ28/Δ28 (I-L, n= 9),and dab1aΔ14/Δ14 (M-P, n= 11) larvae at 5 dpf were stained with anti-Pvalb7 (magenta) and anti-Vglut1 (green) antibodies. Dorsal views with anterior to the left (A-C, E-G, I–K, M-O). Sagittal section images at the level indicated by lines in C, G, K, and O are shown in D, H, L, and P. Typical images are shown. Note that no abnormalities in the development of Pvalb7+ PCs or Vglut1+ GC axons or in the layer formation were observed in the reln and dab1b mutants. CC, crest cerebellaris. The other abbreviations are described in the legend of Fig. 1. Scale bars: 100 μm in A (applies to A-C, E-G, I–K, M-O); 20 μm in D (applies to D, H, L, P). |
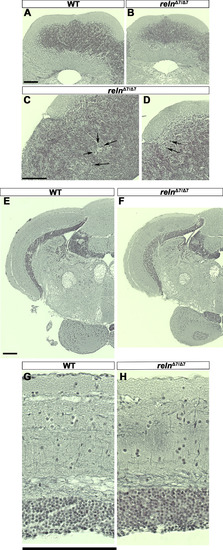
Morphology of the cerebellum and the mesencephalic tectum in reln mutants. Cross sections of the cerebellum (A-D) and the mesencephalon (E-H) of adult WT (A, E, G, n= 2) and relnΔ7/Δ7 mutant (B, C, D, F, and H, n= 2) fish were stained by the Bodian silver impregnation method, which visualizes neuronal fibers (gray) and cell nuclei (purple). (C, D) High magnification images of the relnΔ7/Δ7 mutant cerebellum. Arrows indicate ectopic neurons that have a large soma and are probably PCs in the GCL. (G, H) High magnification images of the WT and relnΔ7/Δ7 mutant tectum. Note that no gross abnormalities in the tectum of the reln mutant were observed. Scale bars: 100 μm in A (applies to A, B); C (applies to C, D); E (applies to E, F); and G (applies to G, H). |
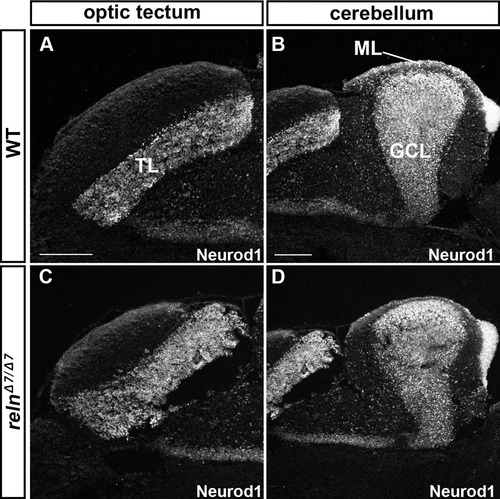
Granule cell (GC) development is not affected in reln mutants. Sagittal sections of the brain from adult (93-dpf) WT (A, B) and relnΔ7/Δ7(C, D) fish were stained with anti-Neurod1 antibodies, which mark the nucleus of immature and mature GCs in the TL, ML, and GCL. Note that the number and position of GC somata were largely unaffected in the relnmutants (n= 6 for WT, and n= 6 for relnΔ7/Δ7 mutants). The abbreviations are described in the legend of Fig. 1. Sale bars: 100 μm in A (applies to A, C); 200 μm in B (applies to B, D). |
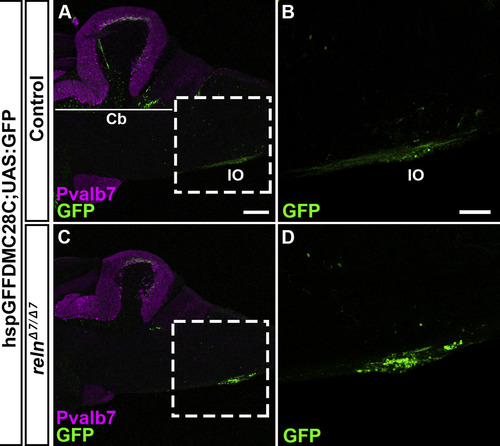
Inferior olivary nuclei (IOs) are not affected in reln mutants. Sagittal section of the brain from adult (90-150-dpf) control (A, B, n= 4) and relnΔ7/Δ7 mutant (C, D, n= 4) fish with hspGFFDM28C; UAS:GFP, which marks the neurons in the IOs and their axons (CFs). (B, D) High magnification images of the boxes in A and C. Typical images are shown. Note that the number and position of the IO neurons were unaffected in the reln mutants. The abbreviations are described in the legend of Fig. 1. Scale bars: 40 μm in A (applies to A, C); 100 μm in B (applies to B, D). |
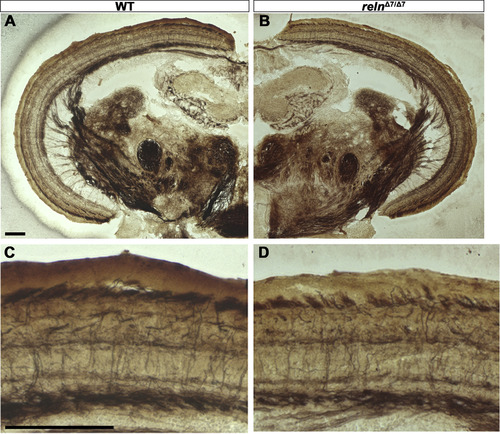
Layer structure of the optic tecum is not affected in reln mutants. Cross sections of the mesencephalon of adult WT (A, C, n= 2) and relnΔ7/Δ7mutant (B, D, n= 2) fish were stained by the Bielschowsky silver impregnation method, which visualizes neuronal fibers. (C, D) High magnification images of the tectum. Note that there was no difference in the neuronal fiber structure between the WT and the reln mutant tectum. Scale bars: 100 μm in A (applies to A, B) and C (applies to C, D). |
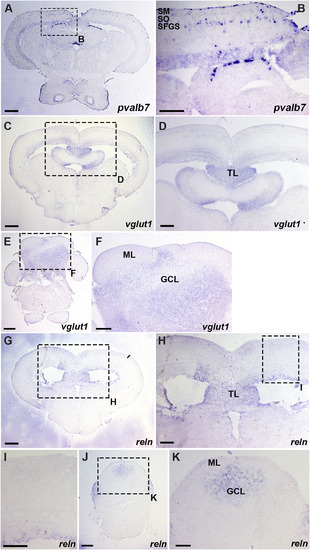
Expression of pvalb7, vglut1, and reln in the mesencephalic tectum and the cerebellum. Cross sections of the mesencephalon (A-D, G-I) and the cerebellum (E, F, J, K) of adult WT zebrafish were stained with antisense riboprobes of pvalb7 (A, B), vglut1 (C–F), or reln (G-K) genes. (B, D, F, H, I, K) High magnification images of the boxes in A, C, E, G, H, and J. Note that pvalb7-expressing cells are located in the SFGS of the tectum (A, B), and reln and vglut1 are not detected in the superficial layer of the tectum and the cerebellum (D, F, H, I). The abbreviations are described in the legend of Fig. 1. Scale bars: 200 μm in A, C, E, G, J; 100 μm in B, D, F, H, I, K. |
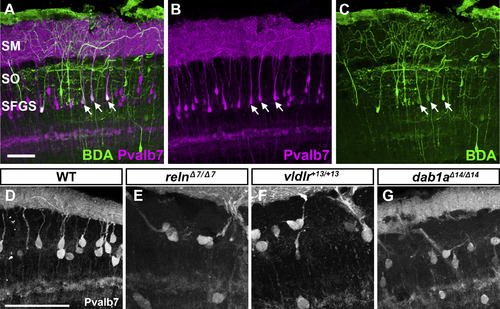
Pvalb7 is a marker for type I neuron. (A-C) Tracing of type I neurons. Biotinylated dextran amine (BDA) was injected into the SM of the tectum. After incubation, transverse sections were labeled with immunofluorescence using anti-Pvalb7 antibody (magenta) and fluorescent streptavidin (green). Note that the neurons labeled with BDA are also positive for Pvalb7 (indicated by arrows). (D-G) High magnification, grayscale images of Pvalb7-positive cells in Fig. 6D, J, P, and V. Scale bars: 50 μm in A (applies to A-C) and D (applies to D-G). |
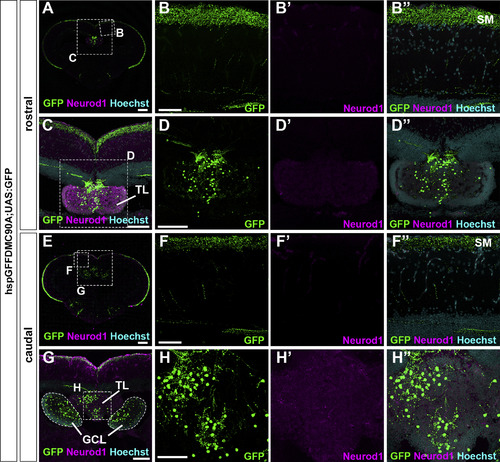
Granule cells in the TL send their axons to the SM in the tectum. Cross sections of a tectum region of the brain from adult hspGFFDMC90A; UAS:GFP fish, which express GFP specifically in GCs in the TL and the cerebellum, were stained with anti-GFP (green) and anti-Neurod1 (magenta) antibodies, and Hoechst (cyan). (B, C, D, F, G, H) High magnification images of the boxes in A, C, E, and G. Note that GFP was detected in the SM, the TL, and the GCL. The abbreviations are described in the legend of Fig. 1. Scale bars: 200 μm in A and E, 100 μm in C, D (applies to D′, D″), and G, 50 μm in B (applies to B, B′, B″); F (applies to F, F′, F″); and H (applies to H, H′, H″). |
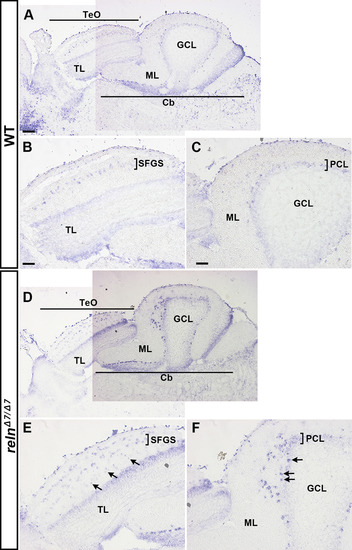
Ectopic type I neurons and Purkinje cells (PCs) in reln mutants. Sagittal sections from the brain of adult (159-dpf) WT (A-C, n= 2) and relnΔ7/Δ7 (D-F, n= 2) zebrafish were stained with an antisense riboprobe for Grid2 interacting protein a (grid2ipa). grid2ipa transcripts were detected in type I neurons located in the SFGS of the TeO, and in PCs in the PCL of the Cb in WT. Ectopic grid2ipa-expressing type I neurons and PCs were observed in the relnΔ7/Δ7 mutants (indicated by arrows). The abbreviations are described in the legend of Fig. 1. Scale bars: 100 μm in A (applies to A, D); 50 μm in B (applies to B, E); 50 μm in C (applies to C, F). |
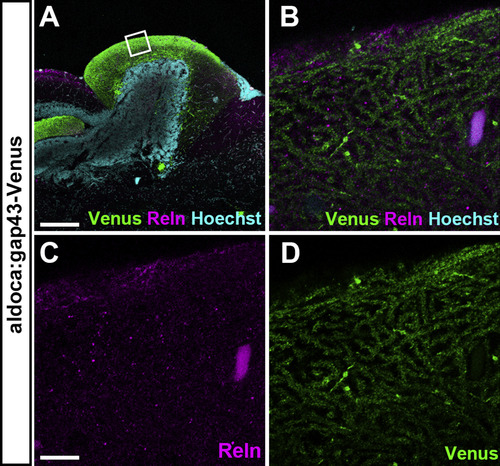
Reln is not colocalized with dendrites of PCs in the ML of the cerebellum. Sagittal sections of the brain from adult Tg(aldoca:gap43-Venus) fish, which express Venus in PCs, were stained with anti-GFP (Venus) and anti-Reln (magenta) antibodies, and Hoechst (cyan). Confocal optical sections (0.93 μm thickness). (B-D) High magnification images of the box in A. Note that Reln is not colocalized with PC dendrites. Scale bars: 200 μm in A; 10 μm in C (applies to B-D). |
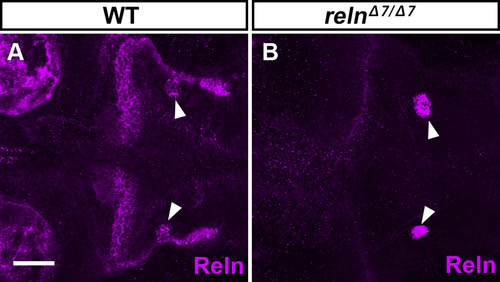
Specific detection of Reln protein by immunostaining. WT (A, n= 4) and relnΔ7/Δ7 (B, n= 3) larvae at 5-dpf were stained with anti-Reln (magenta) antibody. Dorsal views with anterior to the left. Typical images are shown. Note that Reln signals in and near the granule cell axons were severely decreased in the reln mutants. In some reln mutant larvae, nonspecific signals were also seen bilaterally in the hindbrain (marked by arrowheads). Scale bars: 100 μm in A. |
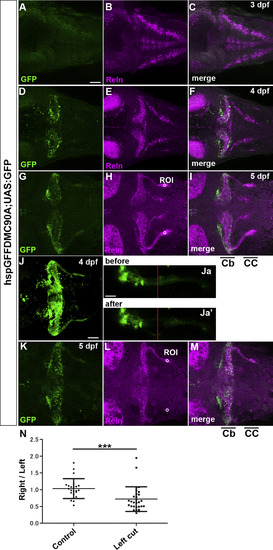
Axon-dependent localization of Reln protein in GCs. (A-I) GC axons and Reln localization. hspGFFDMC90A; UAS:GFP larvae, which express GFP in the soma and axons of GCs, were stained at 3-dpf (A-C), 4-dpf (D-F), and 5-dpf (G-I) with anti-GFP (green) and anti-Reln (magenta) antibodies. Typical data are shown. Reln was detected in or near GC axons in the cerebellum (Cb) and the crista cerebellaris (CC). (J, K) Ablation of GC axons. GC axons in the CC of 4-dpf hspGFFDMC90A; UAS:GFP larvae were ablated by a laser on the left side. (Ja, b) High magnification views of the left GC axons before (Ja) and after the ablation (Ja’). The point of the laser ablation is indicated by red lines. After the ablation, the larvae were reared and subjected to immunostaining with anti-GFP and anti-Reln antibodies at 5 dpf (K). Dorsal views with anterior to the left. Scale bars: 50 μm in A (applies to A-I, K-M); 50 μm in J; 20 μm (applies to Ja, Jb). (N) Fluorescence intensity of Reln signals on the right and left side (ROI, region of interest) in control (H, n= 23) and laser-treated larvae (L, n = 29) was measured. The ratio of the signal on the right to left side in each larva was calculated and plotted in a graph. The ratio was significantly different in the laser-treated larvae (***p< 0.001; Mann-Whitney test). |
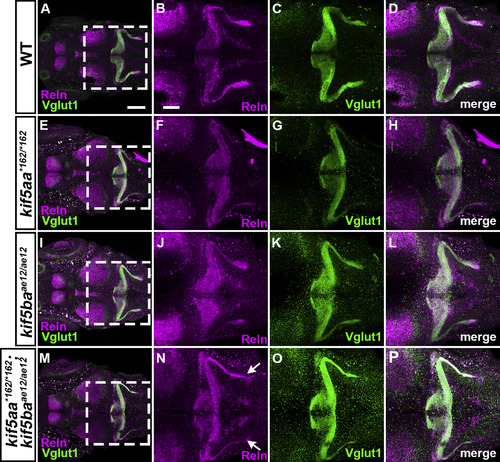
S15. Reln and GC axons in kinesin mutants. WT (A-D, n= 4), kif5aa*162/*162 (E-H, n= 13), kif5baae12/ae12 (I-L, n= 4), and kif5aa*162/*162; kif5baae12/ae12 (M-P, n= 7) larvae at 5-dpf were stained with anti-Reln (magenta) and anti-Vglut1 (green) antibodies. Dorsal views with anterior to the left. (B-D, F–H, J-L, N–P) High magnification images of the boxes in A, E, I, and M. Typical images are shown. Note that the Reln and Vglut1 stainings were not strongly affected in the kif5aa*162/*162 and kif5baae12/ae12single mutants, whereas they were decreased in the double mutants (indicated by arrows in N). Detailed analysis of the double mutants is shown in Fig. S1. Scale bars: 200 μm in A (applies to A, E, I, M); 100 μm in B (applies to B-D, F–H, J-L, N–P). |
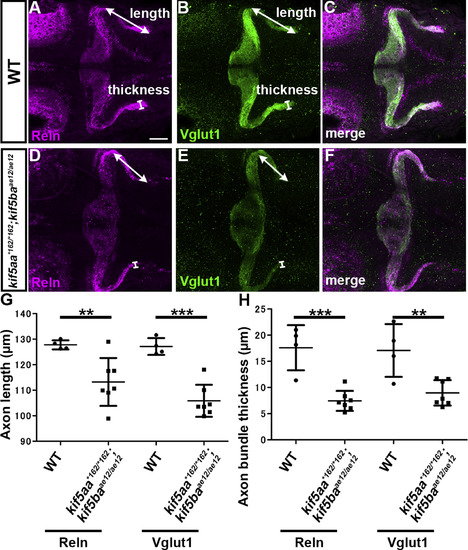
Kinesin-dependent localization of Reln protein. (A-F) Reln protein and granule cell (GC) axons. 5-dpf WT (A-C, n= 4) and kif5aa*162/*162; kif5baae12/ae12 double mutant (D-F, n= 7) larvae were stained with anti-Reln (magenta) and anti-Vglut1 (green) antibodies. Dorsal views with anterior to the left. Scale bars: 50 μm in A (applies to A-F). (G) The length and thickness of the Reln+ and Vglut1+ extra-cerebellar domains were measured and plotted. Both the length and the thickness of the Reln+ and Vglut1+ domains were significantly different in kif5aa; kif5bamutants compared to WT (**p < 0.01; ***p< 0.001; Welch’s t-test for Reelin and Student’s t-test for Vglut1). Note that the granule cell axons were shorter, and Reln protein did not diffuse beyond the axons in the kif5aa; kif5ba mutant hindbrain. |
Reprinted from Developmental Biology, 455(2), Nimura, T., Itoh, T., Hagio, H., Hayashi, T., Di Donato, V., Takeuchi, M., Itoh, T., Inoguchi, F., Sato, Y., Yamamoto, N., Katsuyama, Y., Del Bene, F., Shimizu, T., Hibi, M., Role of Reelin in cell positioning in the cerebellum and the cerebellum-like structure in zebrafish, 393-408, Copyright (2019) with permission from Elsevier. Full text @ Dev. Biol.