
- Title
-
Comprehensive Identification and Spatial Mapping of Habenular Neuronal Types Using Single-Cell RNA-Seq
- Authors
- Pandey, S., Shekhar, K., Regev, A., Schier, A.F.
- Source
- Full text @ Curr. Biol.

Unbiased Clustering of scRNA-Seq Data Identifies 15 Molecularly Distinct Neuronal Clusters in the Larval Habenula (A) Schematic of the zebrafish habenula showing the anatomical subdivisions corresponding to the dorsomedial (orange), dorsolateral (red), and ventral (blue) regions. These subdivisions are known to have distinct gene expression patterns and functionality. (B) Overview of the experimental strategy. Transgenic heads with gng8-GFP positive cells were dissected, pooled, and dissociated, followed by enrichment of GFP+ habenular cells using fluorescent-activated cell sorting (FACS). Single-cell libraries were prepared using droplet-based droplet and plate-based Smart-seq2. Raw reads were processed to obtain a gene expression matrix (genes × cells). PCA and graph clustering was used to divide cells into clusters and identify cluster-specific markers. Validation and spatial localization was performed using fluorescent RNA in situ hybridization (FISH) of statistically significant cluster-specific markers (see STAR Methods). (C) 2D visualization of single-cell clusters using t-distributed stochastic neighbor embedding (t-SNE). Individual points correspond to single cells and are color coded according to their cluster membership determined by graph-based clustering. The t-SNE mapping was only used for post hoc visualization of the clustering but not to define the clusters themselves. (D) Gene expression profiles (columns) of select cluster-specific markers identified through differential expression analysis (DEA) of previously known (labeled with an asterisk [∗]) and new habenular types (rows). Bar on the right displays the percentage of total dataset represented in every cluster, showing the abundance of each cell type found by clustering analysis. (E) A dendrogram representing global inter-cluster transcriptional relationships. The dendrogram was built by performing hierarchical clustering (correlation distance, average linkage) on the average gene-expression profiles for each cluster restricting to the highly variable genes in the dataset. See also Figure S1 and Table S1. |
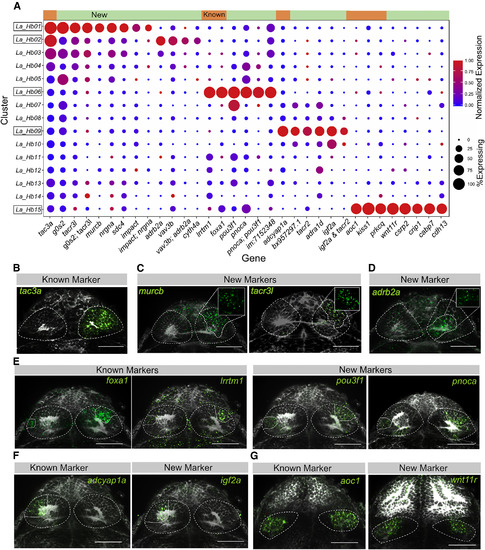
Validation and Spatial Distribution of Previously Described Neuronal Types along with Identified Novel Markers (A) Expression profiles of known and novel habenular marker genes that are specific or enriched in the five clusters displaying previously described gene expression signatures. Green bar on top represents new markers, and orange bar represents known markers. (B–G) In vivo expression patterns of known and novel marker genes that are enriched in clusters harboring previously characterized habenular genes (Hb01, Hb02, Hb06, Hb09, and Hb15). Each type was characterized by both previously described markers, and new markers found from single-cell analysis. RNA-FISH (green) was performed with a total-Erk (pale gray) co-stain for registration (see Figure 3). In some cases, a non-linear filter (gamma = 0.3) was applied to the total-Erk (gray) channel to aid visualization of the in situ signal (green). (B–D) FISH labeling of (B) previously known marker (tac3a) and new markers for (C) Hb01 (murcb, tacr3l) and (D) Hb02 (adrb2a) found by single-cell analysis. Insets show regionalized expression of the gene without total-Erk. (E) FISH labeling of new markers pou3f1 and pnoca enriched in the lrrtm1+ and foxa1+ cluster Hb06. (F) FISH labeling of new marker igf2a enriched in adcyap1a+ left-only cluster Hb09. (G) FISH labeling of new marker wnt11r specific to the aoc1+ ventral habenular cluster Hb15. Scale bars indicate 50 μm. See also Figures S2 and S3, Table S1, and Movie S1. EXPRESSION / LABELING:
|

Validation and Spatial Distribution of 10 Novel Habenular Neuronal Types (A–C) RNA-FISH (green) was performed for specific markers for novel clusters. (A) Left-enriched clusters: Hb07 (pcdh7b), Hb08 (wnt7aa), Hb10 (ppp1r1c); (B) posterior habenular clusters: Hb04 (cbln2b), Hb11 (cpne4a), Hb12/11 (pyya); (C) non-regionalized or rare neuronal types: Hb03 (spx), Hb05 (c1ql4b), Hb14 (slc32a1), and Hb13 (tubb5), each overlaid with a total-Erk co-stain (pale gray) for registration. In each case, representative habenular slices with expression are shown. Full stacks are available through a linked website (see Data and Software Availability). (D) Slices through the registered reference habenula simultaneously showing six marker genes that are expressed in a regionalized pattern: wnt7aa (La_Hb08), adcyap1a (La_Hb07), cbln2b (La_Hb04), murcb (La_Hb01), lrrtm1 (La_Hb06), gpr139 (La_Hb15). (E) Schematic of representative transverse slices through the habenula displaying rough spatial co-ordinates of previously described as well as new neuronal types found by single-cell analysis. Cells are color coded based on their identity in the t-SNE plot (see Figure 1C). Depth is indicated by the z slice in microns. The sectioning extends from z = 0 μm (dorsal) and z = 75 μm (ventral). Only regionalized markers are represented. Schematic is a simplified representation of an accompanying stack of registered habenular markers overlaid onto one another (see Movie S1). Scale bars indicate 50 μm. See also Figure S3, Table S1, and Movie S1. EXPRESSION / LABELING:
|

Comparative Analysis of Habenular Neuronal Types between Larval and Adult Stages (A) t-SNE visualization of adult single-cell clusters obtained by clustering of the adult dataset. Clusters have been labeled post hoc after comparison to the larval dataset (see Figures 5C and 5D). (B) Gene expression profiles (columns) of select cluster-specific markers identified through differential expression analysis (DEA) across all adult clusters. Bar on the right displays percentage of total dataset represented in every adult cluster, showing the abundance of each cell type found by clustering analysis. (C) Dot plot (confusion matrix) showing the proportion of gng8+ cells in the adult dataset (rows) that were classified to larval cluster labels (columns). Each adult habenular type was assigned to a larval cluster label if >15% of the trees in the RF model contributed to the majority vote. Proportion of cells in each row should add to a 100%. (D) Dot plot (confusion matrix) showing the proportion of larval cells (rows) that were classified to cluster labels of the gng8+ cells in the adult dataset (columns). Each adult habenular type was assigned to a larval cluster label if >15% of the trees in the RF model contributed to the majority vote. Proportion of cells in each column should add to a 100%. This training on the adult dataset was performed to validate the robustness of the RF analysis. (E) FISH validation and localization of select dorsal habenular cluster markers. (F) FISH validation of the genes that are expressed in all ventral clusters (aoc1) and across three other ventral sub-clusters (cd82a, mprip, and zgc:173443). See also Figure S5 and Table S2. EXPRESSION / LABELING:
|

Noxious Electric Shocks Activate a Sub-population of Neurons in the Ventro-lateral Habenula Labeled by mprip (A) ISH analysis of cfos expression in the habenula 30 min after exposure to electric shocks. (Scale bars represent 50 μm.) (B) Registration of cfos signals to habenular molecular atlas reveals co-regionalization with the mprip+ ventrolateral population. (Scale bars represent 50 μm). (C) Double ISH for c-fos and mprip (marker for ventrolateral neuronal type) showing a co-localization of cfos+ and mprip+ domains in the larval habenula in response to electric shocks. (Scale bars represent 10 μm). (D) Double ISH of cfos and mprip showing the conservation of electric shocks-induced cfos responses in mprip+ ventro-lateral neuronal type in the adult habenula. Nuclei borders are demarcated in the zoomed in panels on the right using dotted circles. (Scale bar represents 10 μm unless otherwise stated). See also Figure S7 and Movie S2. |
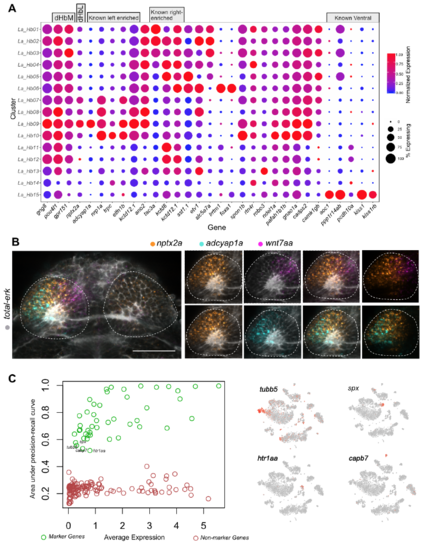
Mapping of Previously Characterized Regionalized Genes onto Droplet Clusters, Related to Figure 2. A. Expression patterns of previously described regionalized habenular genes. Genes that were previously described to be left-right asymmetric and specific to sub-regions (dHbM = dorso-medial habenula, dHbL = dorso-lateral habenula, vHb = ventral habenula) are highlighted with a grey box on top. B. In vivo expression pattern of nptx2a (dHbL marker) together with registered RNA-FISH signals of marker genes. The largest overlap of high nptx2a expressing cells is with the left enriched clusters, Hb08 (wnt7aa+) and Hb09 (adcyap1a+). Panels on the right show individual markers in the left habenula. Scale bar indicates 50 μm. C. Quantification of specificity of marker genes found by single cell analysis. Area under the precision recall curve (AUCPR) for marker genes (green) versus non-marker genes(red) within the same range of expression value [Right panel]. A few marker genes with low AUCPR values constitute those that are expressed in smaller clusters or that belong to the immature neuron cluster (Hb13) whose signatures are spread across multiple clusters in the dataset (see t-SNE plots in the right). EXPRESSION / LABELING:
|
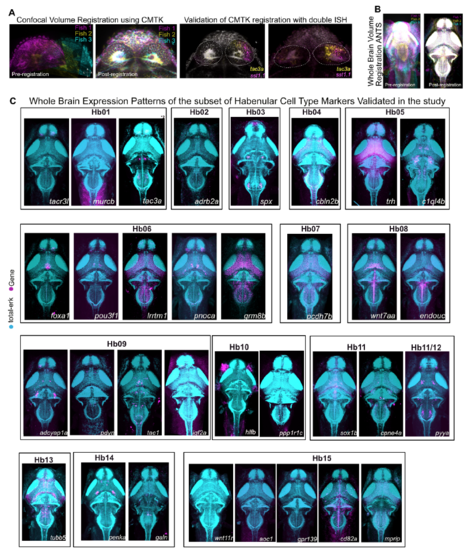
Spatial Registration and Whole Brain Expression Pattern of Habenular Markers, Related to Figures 2 and 3 A. Total-Erk (t-Erk) confocal stacks of the habenula registered to a reference stack using Computational Morphometry Toolkit (CMTK). Shown are outputs across three fish (magenta, yellow and cyan). B. t-Erk confocal stacks of the whole brain registered to a reference stack through using Advanced Normalization Tools (ANTS) software package. Shown are outputs across three fish (magenta, yellow and cyan). C. Maximum intensity projections of whole brain expression patterns of key habenular markers validated in this study to obtain a list of markers that are specific to habenular neuronal types across the brain. Full stacks are available through a linked website [See Additional Resources Section]. |
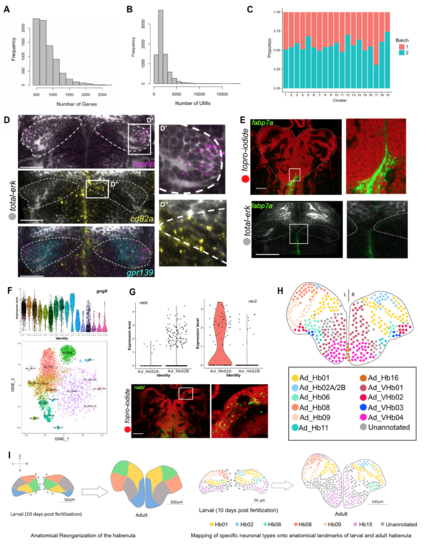
Quality Control of Adult Single Cell RNA-seq Dataset, Related to Figure 5 A. Distribution of genes detected across the filtered adult droplet dataset. B. Distribution of UMIs detected across the filtered adult droplet dataset. C. Composition of each cluster by experimental batch post batch correction and filtering. D. FISH for ventral cluster-specific genes cd82a and mprip that are also identified to be expressed in a regional manner in the larval ventral habenula. E. FISH labeling of fabp7a, marker for a progenitor-like cells in the adult and larval habenula. F. Violin plot showing expression of gng8 in larval and adult dataset. The expression values of gng8 (log(TPM+1) >2) were used to filter the adult dataset for RF analysis. The right panel shows a t-SNE plot of the resulting gng8 positive in the adult dataset. G. Violin plots showing examples of genes differentially expressed between Ad_Hb02A and Ad_Hb02B. Rac2 is enriched in Ad_Hb02A(right) and nebl is enriched in Ad_Hb02B(left) (upper panel). In situ hybridization showing right-enriched expression of nebl in the adult habenula. H. Schematic showing the validated neuronal types in the adult habenula in a single coronal slice. Schematic represents a projection across all slices assayed. Only information about left–right and dorso-ventral positioning of neuronal types is represented. I. Anatomical reorganization of the habenula between the time points analyzed in the study and the rough mapping of select neuronal types onto this map. As described by previous literature, the habenula undergoes complex morphogenetic changes in which the dorso-medial region migrates outwards laterally and the ventrolateral region migrates inwards medially. The positioning of the neuronal types found in our study corroborates this migratory pattern. |
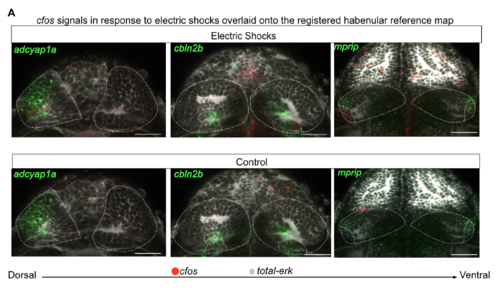
Mapping of cfos Responses onto Neuronal Types Found by scRNA-seq, Related to Figure 7 A. Registration of cfos expression in response to aversive electric shocks onto molecular atlas generated by habenula registration shows major co-regionalization with markers for three clusters found by single cell dataset: Hb09 (adcyap1a), Hb04 (cbln2b) and ventrolateral cluster (mprip). |