
Fig. S3
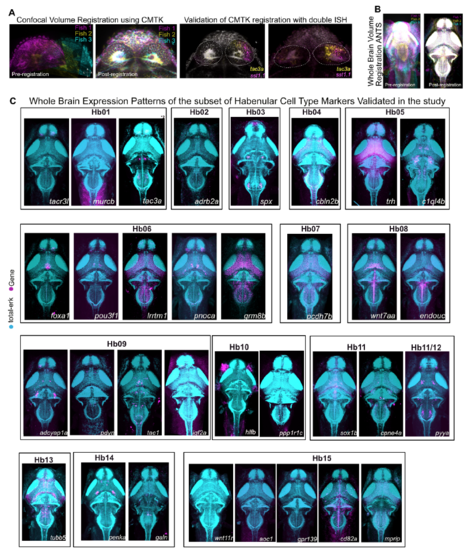
Spatial Registration and Whole Brain Expression Pattern of Habenular Markers, Related to Figures 2 and 3 A. Total-Erk (t-Erk) confocal stacks of the habenula registered to a reference stack using Computational Morphometry Toolkit (CMTK). Shown are outputs across three fish (magenta, yellow and cyan). B. t-Erk confocal stacks of the whole brain registered to a reference stack through using Advanced Normalization Tools (ANTS) software package. Shown are outputs across three fish (magenta, yellow and cyan). C. Maximum intensity projections of whole brain expression patterns of key habenular markers validated in this study to obtain a list of markers that are specific to habenular neuronal types across the brain. Full stacks are available through a linked website [See Additional Resources Section]. |