
- Title
-
Ottogi Inhibits Wnt/β-catenin Signaling by Regulating Cell Membrane Trafficking of Frizzled8
- Authors
- Kim, H.T., Lee, M.S., Jeong, Y.M., Ro, H., Kim, D.I., Shin, Y.H., Kim, J.E., Hwang, K.S., Choi, J.H., Bahn, M., Lee, J.J., Lee, S.H., Bae, Y.K., Lee, J.S., Choi, J.K., Kim, N.S., Yeo, C.Y., Kim, C.H.
- Source
- Full text @ Sci. Rep.

Schematic diagram of results from a large-scale expression screening of human full-length cDNAs. (A) Synthetic mRNA for individual human full-length cDNA clone was injected to one to two-cell stage zebrafish embryos. Injected embryos were examined for morphological defects from early embryogenesis (6 hpf) to organogenesis (24–48 hpf). Total of sixty-four genes caused morphological defects. (B) Types of defects identified from the expression screening. Numbers in parentheses indicate the number of genes that caused particular defect. (C,D) Using bioinformatics tools including PROSITE, SMART and Motif Scan programs, identified genes are classified by biological processes they regulate. |

OTG overexpression causes dorsoanteriorized phenotypes in zebrafish embryos. (A) Un-injected control embryo. (B–D) Phenotypes of OTG mRNA-injected embryos were classified into three classes (see text). (E) Frequencies of phenotypes caused by injection of indicated amounts of OTG mRNA. (F–O) Views from animal pole, dorsal to the right (F–I,L,M). Lateral view (J,K,N,O). Expression patterns of shield markers chd (F, 20/20, 100%; G, 13/15, 87%) and gsc (H, 15/15, 100%; I, 14/15, 93%), a ventral marker bmp2 (J, 12/12, 100%; K, 11/12, 92%), a ventral mesoderm marker eve1 (L, 10/10, 100%; M, 11/12, 92%), and anterior neural marker otx2 and a posterior neural marker hoxa1 (N, 12/12, 100%; O, 15/16, 94%) in un-injected control embryos (F,H,J,L,N) or OTG mRNA-injected embryos (G,I,K,M,O) at indicated developmental stages. (P,Q) Dorsal views, anterior to the left. Expression pattern of pax6 in un-injected control (P, 20/20, 100%) or OTG mRNA-injected (Q, 14/16, 87%) embryo at 20-somite stage (22 hpf). Abbreviations. e, eye; f, forebrain; h, hindbrain; m, midbrain. |
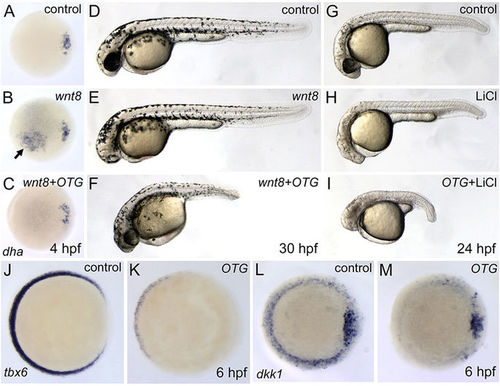
OTG inhibits Wnt/β-catenin signaling pathway during early development. (A–C) Views from animal pole, dorsal to the right. Expression pattern of dha in control (A, 10/10, 100%), wnt8 mRNA-injected (B, 14/15, 93%), or wnt8 and OTG mRNA-injected embryo (C, 12/13, 92%) at sphere stage (4 hpf). Arrow indicates Wnt8-induced ectopic expression of dha. (D–F) Morphology of control (D, 10/10, 100%), wnt8 mRNA-injected (E, 18/20, 90%), or wnt8 and OTG mRNA-injected embryo (F, 17/20, 85%) at 30 hpf. (G–I) Morphology of control (G, 12/12, 100%), LiCl treated (H, 13/15, 86%), or LiCl treated and OTG mRNA-injected embryo (I, 14/15, 93%) at 24 hpf. (J–M) Views from animal pole, dorsal to the right. Expression pattern of tbx6 (J, 10/10, 100%; K, 18/20, 90%) or dkk1 (L, 10/10, 100%; M, 17/20, 85%) in control (J,L) or OTG mRNA-injected (K,M) embryo at 6 hpf. |
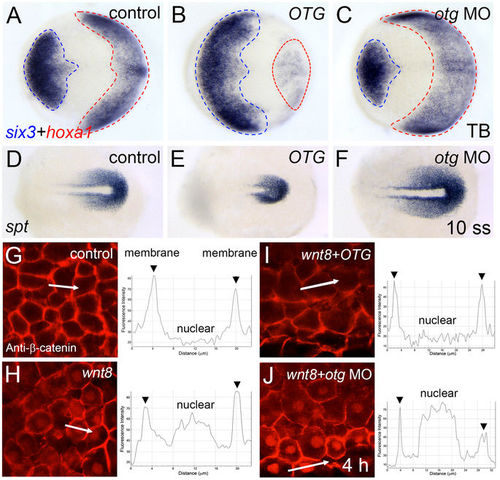
Loss of otg function affects AP-DV patterning and nuclear β-catenin localization. (A–C) Doral views, anterior to the left. Expression patterns of an anterior neural marker six3 and a posterior neural marker hoxa1 in control (A, 12/12, 100%), OTG mRNA-injected (B, 17/20, 85%) or otg MO-injected (C, 16/18, 89%) embryo at tail bud stage (10 hpf). (D–F) Doral views, posterior to the right. Expression pattern of a posterior mesoderm marker spt in control (D, 10/10, 100%), OTG mRNA-injected (E, 18/20, 90%) and otg MO-injected (F, 20/23, 87%) embryo at 10 somite stage. (G–J) Views of animal pole cells at blastula stage. Immunostaining for β-catenin and fluorescence intensity profile along the white lines in control (G), wnt8 mRNA-injected (H), wnt8 and OTG mRNA-injected (I), or wnt8 mRNA and otg MO-injected (J) embryo. EXPRESSION / LABELING:
PHENOTYPE:
|
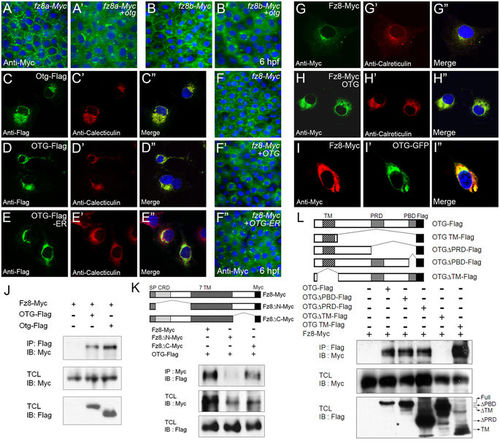
OTG prevents membrane targeting of Fz8 receptor and restricts Fz8 to the ER. (A,B) Immunostaining of Myc (green) in embryos (6 hpf) injected with indicated combinations of otg, fz8a-myc and fz8b-myc mRNAs. For panels A–I, nuclei are counter-stained with Hoechst 33342 (blue). (C–E) COS-7 cells were transfected for C-terminal Flag-tagged zebrafish Otg (C), human OTG (D), or human OTG with C-terminal fusion of an ER retention sequence KDEL (OTG-Flag-ER, E). Cells are immunostained for Flag (green) and an ER marker calreticulin (red). (F) Immunostaining of Myc (green) in embryos (6 hpf) injected with indicated combinations of OTG, OTG-ER and fz8-myc mRNAs. (G,H) COS-7 cells were transfected for Fz8-Myc alone (H) or with OTG (I). Cells are immunostained for Myc (green) and calreticulin (red). (I) NIH3T3 cells were transfected for Fz8-Myc and OTG-GFP. Cells are immunostained for Myc (red) and GFP (green). (J–L) Schematic representations of various deletion constructs are shown at the top of each panel. HEK293 cells were transfected for indicated combinations of OTG (OTG-flag), Otg (Otg-Flag) and Fz8-Myc. Interaction between Fz8 and OTG/Otg is examined by immunoprecipitation for OTG/Otg (IP: Flag) or Fz8 (IP: Myc) followed by immunoblotting for Fz8 (IB; Myc) or OTG (IB: Flag). Levels of proteins in total cell lysates (TCL) are also compared. Full-length blots are presented in Supplementary Fig. S19. |

OTG regulates glycosylation of Fz8 receptor. (A–D) Immunostaining of Myc (green) in embryos (10 hpf) injected with fz8-myc mRNA alone (A), with OTG mRNA (C), with otg MO (D) or treated with an N-glycosylation inhibitor tunicamycin (B). For panels A–D and G–I, nuclei are counter-stained with Hoechst 33342 (blue). (E) HEK293 cells were transfected for Fz8-Myc and increasing amounts of OTG-Flag. Overexpressed Fz8-Myc (anti-Myc) and OTG-Flag (anti-Flag) proteins are analyzed by immunoblotting. (F) HEK293 cells were transfected for Fz8-Myc and then treated with tunicamycin, or their lysates were incubated with endoglycosidase H (Endo H) or O-glycosidase (O-Gly). Overexpressed Fz8-Myc protein (anti-Myc) is analyzed by immunoblotting. Full-length blots are presented in Supplementary Fig. S19. (G–I) HEK-293 cells were transfected with Fz8-Myc and then treated with vehicle DMSO alone (G) or with tunicamycin [0.1 μg/ml (H) and 1 μg/ml (I)]. Cells are immunostained for Myc (green). |

Putative N-glycosylation sites of Fz8 receptor are important for Wnt8 signaling. (A) Schematic representation of putative N-glycosylation sites in zebrafish Fz8a receptor. Abbreviations. CRD, Cystein rich domain; ICD, Intercellular domain; SP, Signal peptide; TM, Transmembrane domain. (B–F) HEK293 cells were transfected with indicated Fz8 construct and overexpressed Fz8 protein is analyzed by anti-Myc immunoblotting (B) or anti-Myc immunostaining (green) (C–F). For panels C–J, nuclei are counter-stained with Hoechst 33342 (blue). Full-length blots are presented in Supplementary Fig. S19. (G—J) Immunostaining of Myc (green) in embryos (6 hpf) injected with mRNA for indicated wild type or mutant fz8a-myc. (K) Embryos were injected with indicated combinations of wnt8 and fz8 mRNAs. Left panel: Resulting phenotypes are classified from Class I (normal) to Class 4 (most severe). Right panel: Phenotype frequencies of embryos injected with indicated combinations of mRNAs. |
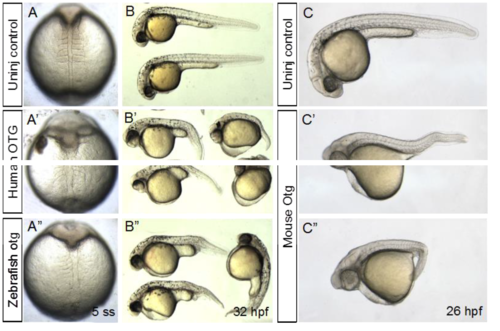
Overexpression analysis of human,mouse, and zebrafish OTG genes (A-A") Dorsal views of five-somite stage embryos injected human and zebrafish OTG injected embryos, compared to that of control embryo. Dorsal view, anterior is to the top. (B-B") Lateral views of 32 hpf embryos injected human (B') and zebrafish OTG (B"). (C-C") Big head phenotype is also seen in mouse Otg injected embryos at 26 hpf. |
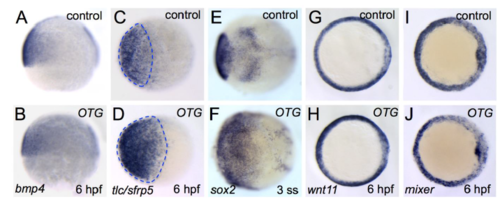
Expression patterns of early markers in OTG-overexpressed embryos Expression of patterns of a ventral marker bmp4 (A, 10/10, 100%; B, 14/15, 93%), an anterior neural plate marker tlc/sfrp5 (C, 12/12, 100%; D, 13/15, 86%), a pan-neural marker sox2 (E, 10/10, 100%; F, 12/13, 92%), endoderm markers wnt11 (G, 11/11, 100%; H, 12/12, 100%) and mixer (I, 10/10, 100%; J, 10/10, 100%) in un-injected control (A, C, E, G, I) or OTG mRNA-injected (B, D, F, H, J) embryos. (C, D and G-J) Embryos at the onset of gastrulation (6 hpf), views from animal pole, dorsal on the right side. (A, B) Side view. (E-F) Embryos at 3 somite stage (3 ss), dorsal views, anterior to the left. Note that the expression domains of bmp4, tlc/sfrp5 and sox2 are expanded in OTG-overexpressed embryos whereas those of wnt11 and mixer are not affected. |

OTG acts upstream of β-catenin and tcf3/hdl in Wnt signaling pathway (A-C) Top view, dorsal is to the right. Expression pattern of chd in control (A, 10/10, 100%), wnt8 mRNA-injected (B, 8/10, 80%), or wnt8 and OTG mRNA-injected (C, 10/12, 83%) embryo at sphere stage (4 hpf). Wnt8-induced ectopic expression of chd was inhibited by OTG overexpression. (D-F') Morphology and expression pattern of shh (insets) in control (D, 10/10, 100%; D'), β- catenin mRNA-injected (E, 12/15, 80%; E'), or β-catenin and OTG mRNA-injected (F, 13/14, 93%; F') embryo at 30 hpf and 6 ss. OTG overexpression does not inhibit β-catenin-induced ectopic eye formation or secondary axis formation marked by the ectopic expression of shh. (G-I) Morphology of control (G, 10/10, 100%), VP16-tcf3 (a dominant negative form of tcf3) mRNA-injected (H, 14/18, 78%), or VP16-tcf3 and OTG mRNA-injected (I, 16/18, 89%) embryo at 30 hpf. OTG overexpression does not rescue VP16-tcf3-induced headless-like phenotype. (J-L) Morphology of control (J, 10/10, 100%), SB415286 treated (K, 14/15, 93%), or SB415286 treated and OTG mRNA-injected embryo (L, 14/18, 78%) at 28 hpf. Injection of OTG mRNA does not rescue SB415286-induced headless-like phenotype. |

Expression profile of otg in zebrafish embryos (A) Semi-quantitative RT-PCR analysis of zebrafish ottogi. β-actin is used as a loading control. ottogi transcript is detected from 4-cell to the prim-5 stages (24 hpf). (B-L) In situ hybridization of zebrafish otg at indicated stages. (B-F) otg is ubiquitously expressed from early cleavage to 10-somite stages. (G) otg expression in brain region is increased at late somitogenesis stage. (H) At 24 hpf, otg transcripts are detected in the brain and proximal convoluted tubule (PCT, inset) of pronephros. (I) At 36 hpf, otg expression persists in the brain and pronephric ducts. (J) Cross section of embryo at panel (I) shows that otg transcripts are detected in anterior pronephric ducts (arrows) at 36 hpf. (K) otg transcripts are detected in the brain, pharyngeal arch (PA), and PCT at 72 hpf. (L) In sagittal section of adult brain, otg transcripts are detected in corpus cerebelli (CCe), dorsal thalamus (DT), griseum centrale (GC), periventricular gray zone of optic tectum (PGZ, layers 1 and 2), and torus longitudinalis (TL). TeO indicates tectum opticum. |
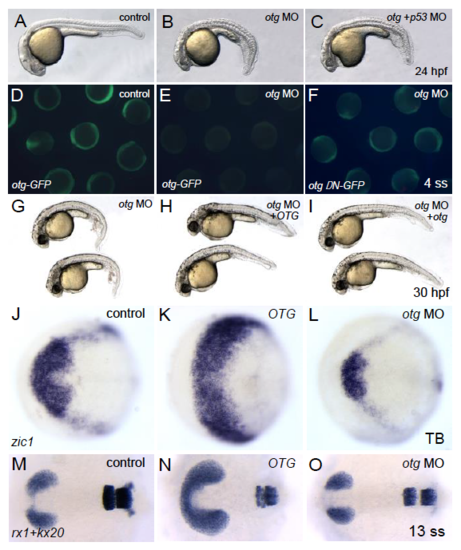
Loss of otg function leads to a ventralized phenotype. (A-C) Morphology of control (A, 20/20, 100%), otg MO-injected (B, 23/25, 92%), or otg and p53 MO-injected (C, 22/23, 96%) embryo at 24 hpf. Injection of otg MO causes a ventralized phenotype (including small head/eye and expansion of ventral mesoderm) and co- injection of p53 MO does not affect the ventralized phenotype of otg morphants. (D-F) GFP expression at 4-somite stage embryos injected with indicated combinations of control MO, otg MO, otg-GFP (otg MO-targeted) mRNA and otg-N-GFP (otg MO non-targeted) mRNA. Otg-GFP is robustly expressed in control MO-injected embryos (D, 10/10, 100%) but not in otg MO-injected embryos (E, 14/15, 93%). Expression of Otg-N-GFP is not affected by otg MO (F, 13/13, 100%). (G-I) Morphology of 30 hpf embryos injected with otg MO alone (G, 15/15, 100%), or with human OTG mRNA (H, 14/16, 87%) or zebrafish otg mRNA (I, 10/15, 66%). otg MO-induced ventralized phenotype (including expansion of ICM and small head) is rescued by OTG/otg mRNA co-injection. (J-L) Expression pattern of a presumptive eye field marker zic1/opl in control (J, 14/14, 100%), OTG mRNA-injected (K, 20/22, 91%) or otg MO-injected (L, 18/20, 90%) embryo at neural plate stage. Dorsal view, anterior is to the left. Overexpression of OTG caused dramatic expansion of zic1/opl expression domain whereas loss of otg function caused reduction. (M-O) Expression pattern of an eye field marker rx1 and a hindbrain markers krox20 in control (M, 12/12, 100%), OTG mRNA- injected (N, 15/16, 94%) or otg MO-injected (O, 20/22, 91%) embryo at 13-somite stage. Dorsal view, anterior is to the left. Overexpression of OTG caused expansion of rx1 expression domain whereas loss of otg function caused reduction. EXPRESSION / LABELING:
|

OTG inhibits reporter expression in TOPdGFP transgenic zebrafish Views from animal pole, dorsal is to the right. Patterns of GFP reporter expression in control (A, 10/10, 100%), human OTG mRNA-injected (B, 12/13, 92%), zebrafish otg mRNA- injected (C, 12/14, 86%), or otg MO-injected (D, 18/20, 90%) embryo at shield stage (6 hpf). E-H. OTG overexpression suppresses whereas otg knockdown enhances Wnt8-induced reporter expression. TOPdGFP transgenic embryos were injected with indicated combination of wnt8 (7/7, 100%), human OTG (8/10, 80%), zebrafish otg mRNAs (6/10, 60%) and zebrafish otg morpholino (MO, 14/16, 87%). GFP reporter expression is examined by in situ hybridization. |
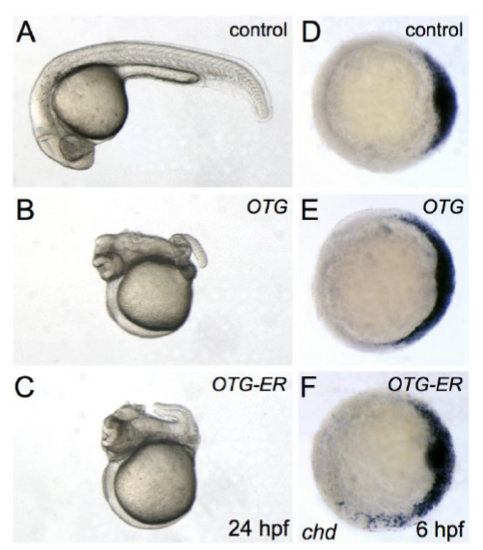
ER-restricted OTG (Otg-ER) retains its activity (A-F) Morphology (A-C, at 24 hpf) and expression pattern of a dorsal organizer marker chd (D-F, 6 hpf; animal pole view, dorsal is to the right) of control (A, 13/13, 100%; D, 10/10, 100%), OTG mRNA-injected (B, 20/21, 95%; E, 12/13, 92%), or an ER-restricted OTG-ER mRNA-injected (C, 22/24, 92%; F, 11/13, 85%) embryos. Similar to wild type OTG, OTG- ER causes dorsalization and expansion of chd expression domain. |

Effects of various OTG deletion mutants in zebrafish development (A-F) Morphology (at 36 hpf) of control embryo (A, 12/12, 100%) and embryos injected with mRNA for indicated OTG deletion mutant. Overexpression of OTGPBD-Flag results enlarged head and shortened tail (F, 15/16, 94%) similar to wild type OTG (B, 15/15, 100%). OTG TM-Flag (C, 10/14, 71%) and OTGPRD-Flag (E, 12/16, 75%) lead to small head with normal tail. OTGTM-Flag does not cause any discernible defect. (G-L) Immunostaining of overexpressed Fz8-Myc (green) in shield stage embryos injected with mRNA for fz8-myc alone (G) or with mRNA for indicated OTG-Flag deletion mutant. Overexpressed Fz8-myc proteins (green) are visualized by anti-Myc immunostaining. Nuclei are counter-stained with Hoechst 33342 (blue). Cell surface expression of Fz8-Myc is affected by OTG-Flag (H) and OTGPBD-Flag (L). However, OTG TM-Flag (I), OTGTM- Flag (J), and OTGPRD-Flag (K) do not affect the membrane localization of Fz8-Myc. |