
|
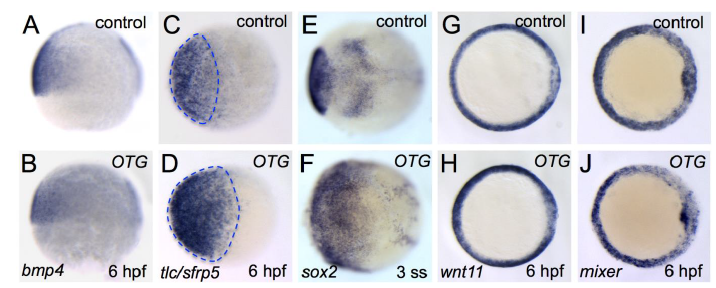
Fig. s3 Expression patterns of early markers in OTG-overexpressed embryos
Expression of patterns of a ventral marker bmp4 (A, 10/10, 100%; B, 14/15, 93%), an anterior neural plate marker tlc/sfrp5 (C, 12/12, 100%; D, 13/15, 86%), a pan-neural marker sox2 (E, 10/10, 100%; F, 12/13, 92%), endoderm markers wnt11 (G, 11/11, 100%; H, 12/12, 100%) and mixer (I, 10/10, 100%; J, 10/10, 100%) in un-injected control (A, C, E, G, I) or OTG mRNA-injected (B, D, F, H, J) embryos. (C, D and G-J) Embryos at the onset of gastrulation (6 hpf), views from animal pole, dorsal on the right side. (A, B) Side view. (E-F) Embryos at 3 somite stage (3 ss), dorsal views, anterior to the left. Note that the expression domains of bmp4, tlc/sfrp5 and sox2 are expanded in OTG-overexpressed embryos whereas those of wnt11 and mixer are not affected.