|
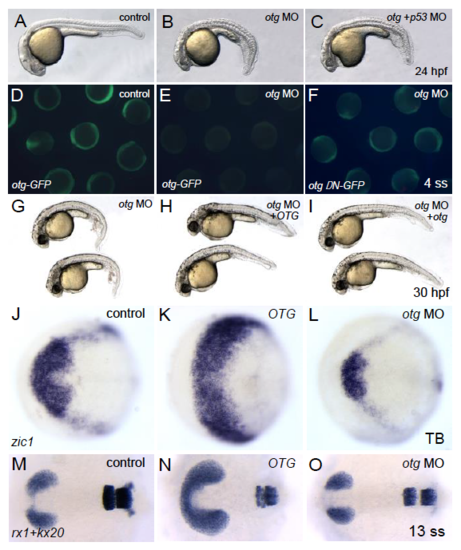
Loss of otg function leads to a ventralized phenotype. (A-C) Morphology of control (A, 20/20, 100%), otg MO-injected (B, 23/25, 92%), or otg and p53 MO-injected (C, 22/23, 96%) embryo at 24 hpf. Injection of otg MO causes a ventralized phenotype (including small head/eye and expansion of ventral mesoderm) and co- injection of p53 MO does not affect the ventralized phenotype of otg morphants. (D-F) GFP expression at 4-somite stage embryos injected with indicated combinations of control MO, otg MO, otg-GFP (otg MO-targeted) mRNA and otg-N-GFP (otg MO non-targeted) mRNA. Otg-GFP is robustly expressed in control MO-injected embryos (D, 10/10, 100%) but not in otg MO-injected embryos (E, 14/15, 93%). Expression of Otg-N-GFP is not affected by otg MO (F, 13/13, 100%). (G-I) Morphology of 30 hpf embryos injected with otg MO alone (G, 15/15, 100%), or with human OTG mRNA (H, 14/16, 87%) or zebrafish otg mRNA (I, 10/15, 66%). otg MO-induced ventralized phenotype (including expansion of ICM and small head) is rescued by OTG/otg mRNA co-injection. (J-L) Expression pattern of a presumptive eye field marker zic1/opl in control (J, 14/14, 100%), OTG mRNA-injected (K, 20/22, 91%) or otg MO-injected (L, 18/20, 90%) embryo at neural plate stage. Dorsal view, anterior is to the left. Overexpression of OTG caused dramatic expansion of zic1/opl expression domain whereas loss of otg function caused reduction. (M-O) Expression pattern of an eye field marker rx1 and a hindbrain markers krox20 in control (M, 12/12, 100%), OTG mRNA- injected (N, 15/16, 94%) or otg MO-injected (O, 20/22, 91%) embryo at 13-somite stage. Dorsal view, anterior is to the left. Overexpression of OTG caused expansion of rx1 expression domain whereas loss of otg function caused reduction.
|