
- Title
-
Rdh10a Provides a Conserved Critical Step in the Synthesis of Retinoic Acid during Zebrafish Embryogenesis
- Authors
- D'Aniello, E., Ravisankar, P., Waxman, J.S.
- Source
- Full text @ PLoS One
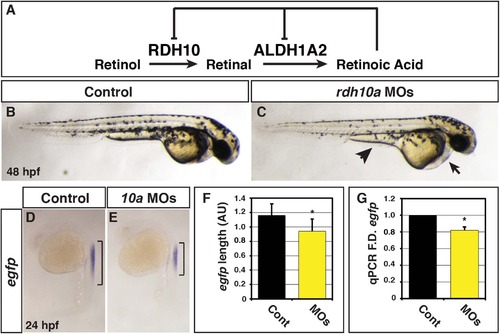
Rdh10a deficient embryos have decreased RA signaling. (A) Schematic of the metabolic pathway that synthesizes RA during development and negative regulation of Rdh10 and Aldh1a2 expression from mice and Xenopus studies [23, 28, 29]. (B) Control sibling embryo. (C) Embryos injected with rdh10a MOs. Arrow indicates pericardial edema. Arrowhead indicates yolk extension. (D-E) ISH for egfp expression in Tg(12XRARE-ef1a:EGFP)sk72 control sibling and Rdh10a deficient embryos. Brackets indicate the length of egfp expression in the spinal cord. (F) Measurements of egfp expression length in the spinal cord using arbitrary units (AU) from in situ hybridization (ISH) of Tg(12XRARE-ef1a:EGFP)sk72 control embryos (n = 16) and Rdh10a deficient embryos (n = 15). (G) RT-qPCR for egfp expression at 24 hpf in control sibling and Rdh10a deficient embryos. In all graphs, asterisks indicate a statistically significant difference (p<0.05) and bars indicate standard deviation. |
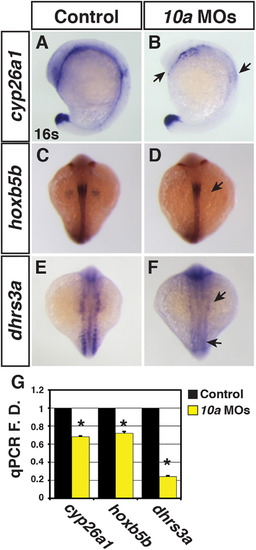
Rdh10a deficient embryos have decreased expression of RA signaling responsive genes. (A-F) ISH for cyp26a1, hoxb5b, and dhrs3a expression in control sibling and Rdh10a deficient embryos. In A and B, views are lateral with dorsal rightward. In C-F, views are dorsal. In all images anterior is up. Arrows in B, D and F indicate decreased expression relative to control sibling embryos. (G) RT-qPCR for RA signaling responsive genes. EXPRESSION / LABELING:
PHENOTYPE:
|
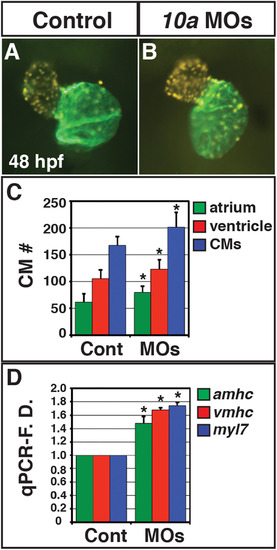
Rdh10a deficient embryos have increased CM number. (A, B) Hearts from control sibling (n = 10) and Rdh10a deficient (n = 10) Tg(-5.1myl7:DsRed2-NLS)f2 embryos. Images are frontal views. Red indicates ventricle. Green indicates atrium. (C) Mean CM number at 48 hpf. (D) RT-qPCR for CM differentiation marker gene expression at 48 hpf. |
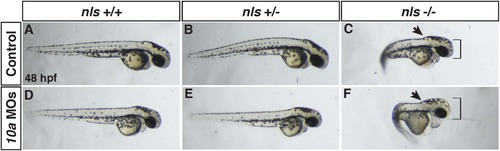
Rdh10a depletion enhances defects in nls/aldh1a2 mutant embryos. (A, D) WT control and Rdh10a deficient embryos. (B,E) Control and Rdh10a deficient embryos heterozygous for the nls allele. (C,F) Control and Rdh10a deficient embryos homozygous for the nls allele. Nls mutant embryos (C) show anteriorization of nervous system (black arrowhead), increases in the size of the head (black bracket), and pericardial edema. Rdh10a deficient; nls mutant embryos (F) have an accentuated anteriorization of the nervous system (arrowhead), larger and dysmorphic head (red bracket), and enhanced pericardial edema compared to nls embryos. Dorsal is up and anterior is to the right. PHENOTYPE:
|
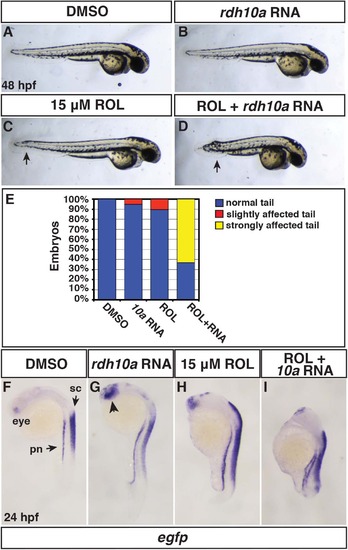
Rdh10a overexpression promotes embryonic RA signaling. (A, F) Control DMSO treated, (B,G) rdh10a mRNA (300 pg), (C,H) ROL treated (15 µM), and (D,I) ROL treated, rdh10a mRNA injected embryos. (A-D) At 48 hpf, DMSO and rdh10a mRNA injected embryos were overtly normal. 15 µM ROL produced overtly normal embryos, except some have a modestly shortened, kinked tail (arrow in C). ROL treated, rdh10a mRNA injected embryos were severely truncated. Views are lateral with dorsal up and anterior right. (E) Percentage of truncated embryos at 48 hpf in A-D. For each condition n = 19 embryos. (F-I) ISH for egfp expression in Tg(12XRARE-ef1a:EGFP)sk72 embryos. In F, pn indicates pronephros and sc indicates spinal cord. In G, arrowhead indicates anterior neural expression. Views are lateral with dorsal right and anterior up. |
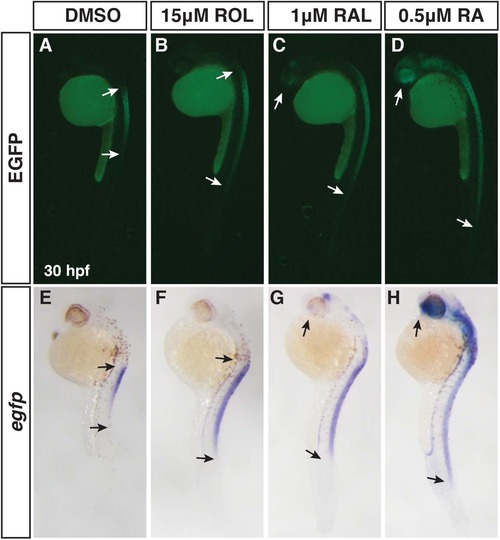
Differential abilities of ROL, RAL, and RA to promote RA signaling. (A-D) EGFP fluorescence in Tg(12XRARE-ef1a:EGFP)sk72 embryos after treatment with 15 µM ROL, 1 µM RAL, and 0.5 µM RA beginning at 24 hpf. (E-H) ISH for egfp expression in Tg(12XRARE-ef1a:EGFP)sk72 embryos after treatment with 15 µM ROL, 1 µM RAL, and 0.5 µM RA beginning at 24 hpf. Arrows indicate the boundaries of expression. Views are lateral with dorsal right and anterior up. |
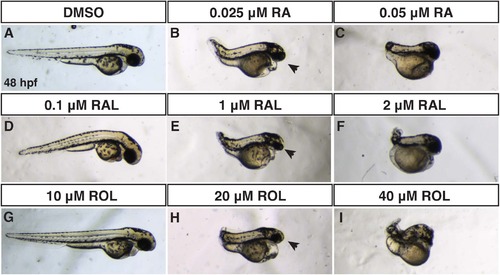
Comparison of RA, RAL, and ROL teratogenicity. (A-J) Embryos at 48 hpf that were treated from sphere stage through 24 hpf with DMSO, ROL, RAL, and RA. (D,G) Low concentrations of RAL (0.1 µM) and ROL (10 µM) did not cause significant overt defects. (B,E,H) Intermediate concentrations of RAL (1 µM) and ROL (20 µM) and the lower concentration of RA (0.025 µM) produced truncated embryos that still had eyes (arrows). (C,F,I) 0.05 µM RA, 2 µM RAL, and 40 µM ROL produced severely truncated embryos without eyes. PHENOTYPE:
|
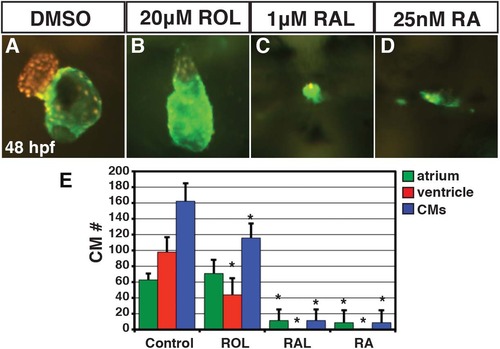
ROL, RAL, and RA eliminate CMs. (A-D) Hearts from Tg(-5.1myl7:DsRed-NLS)f2 embryos treated with DMSO, 20 µM ROL, 1 µM of RAL and 0.025 µM RA. Images are frontal views. Red indicates ventricle. Green indicates atrium. (E) Mean CM number at 48 hpf. |
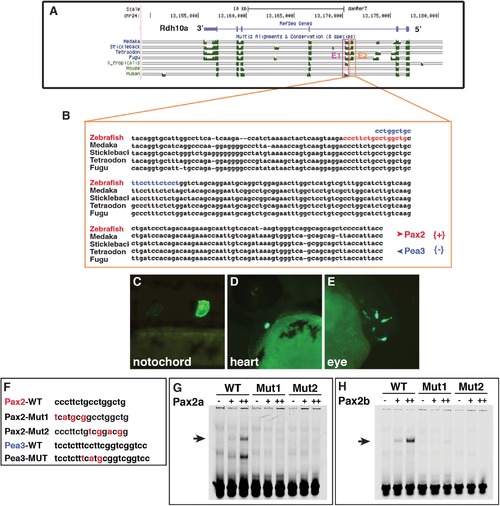
Zebrafish Pax2 proteins bind a putative Rdh10a enhancer. (A) Alignment of vertebrate rdh10 genes to the zebrafish rdh10a taken from the UCSC genome browser. (B) Sequence alignment of the E2 enhancer in teleosts. Red nucleotides indicate the predicted Pax2 binding site. Blue indicates the Pea3 binding site (C-E) Representative images from transient transgenic embryos with rdh10a E2-enhancer expression in the notochord, heart, and eye. (F) Mutations that were made in the promoter of the rdh10a E2-enhancer and the oligos used for EMSA. (G,H) EMSA with the WT and mutated Pax2 sites and zebrafish Pax2a and Pax2b. |
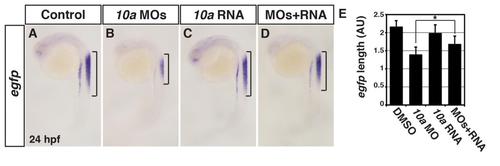
Specificity controls for the Rdh10a MOs. (A-D) ISH for egfp expression in Tg(12XRARE-ef1a:EGFP)sk72 control sibling (n = 13), Rdh10a deficient (n = 21), rdh10a mRNA injected (n = 20), and Rdh10a deficient + rdh10a mRNA injected embryos (n = 14). Brackets indicate the length of egfp expression in the spinal cord. Images are lateral views at 24 hpf. (E) Measurements of egfp expression length in the spinal cord of Tg(12XRARE-ef1a:EGFP)sk72 embryos in arbitrary units (AU). |
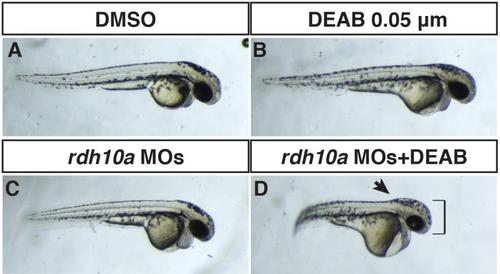
Rdh10a depletion enhances defects caused by inhibition of Aldh1a2. (A) Control sibling embryo treated with DMSO. (B) Embryo treated with 0.05 µM DEAB (a suboptimal concentration) that has mild defects indicated of loss of RA signaling. (C) Rdh10a deficient embryo. (D) Rdh10a deficient embryos treated with the suboptimal concentration of DEAB results in an interaction that produces defects reminiscent of Rdh10a depleted nls mutant embryos (Fig 4). The head is enlarged (brackets) and the border between the hindbrain and anterior spinal cord is accentuated (arrow), indicating the hindbrain is anteriorized. |
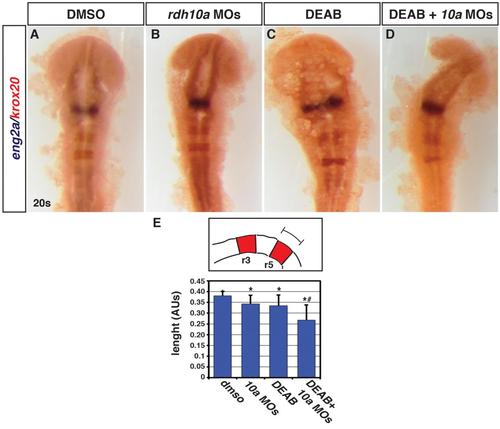
Functional interaction between Rdh10a depletion and Aldh1a2 inhibition in the hindbrain. (A-D) ISH for eng2a (blue), which marks the midbrain-hindbrain boundary, and egr2b (red), which marks rhombomeres (r) 3 and 5. Control DMSO treated (n = 13), Rdh10a deficient embryos (n = 13), 0.05 µM DEAB treated (n = 12), and Rdh10a deficient + 0.05 µM DEAB embryos (n = 14). (E) Schematic and measurements of r5 length in arbitrary units (AU). Asterisks indicate a statistical significant difference between embryos treated with the DMSO versus all the other conditions. Hashtag indicates a statistically significant difference between embryos injected with rdh10a MOs or treated with DEAB versus the embryos treated with DEAB and injected with rdh10a MOs. |
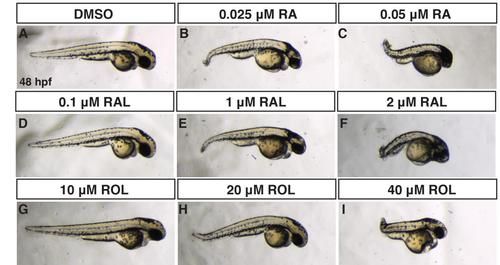
Comparison of ROL, RAL and RA teratogenicity from treatments beginning at the shield stage. (A-I) Embryos at 48 hpf that were treated from shield stage through 24 hpf with DMSO, ROL, RAL, and RA. (D,G) Low concentrations of RAL (0.1 µM) and ROL (10 µM) did not cause significant overt defects. (B,E,H) Intermediate concentrations of RAL (1 µM) and ROL (20 µM) and the lower concentration of RA (0.025 µM) produced truncated embryos that still had eyes (arrows). (C,F,I) 0.05 µM RA, 2 µM RAL, and 40 µM ROL produced severely truncated embryos with reduced eyes. |
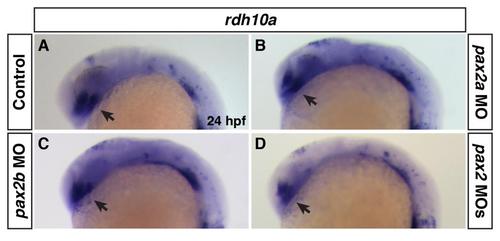
Rdh10a expression in Pax2 deficient embryos. (A-D) Rdh10a expression at 24 hpf of control sibling, Pax2a deficient, Pax2b deficient, and Pax2a+Pax2b deficient embryos. There was no discernible effect on rdh10a expression in the eyes (arrows) between control and Pax2 deficient embryos. |
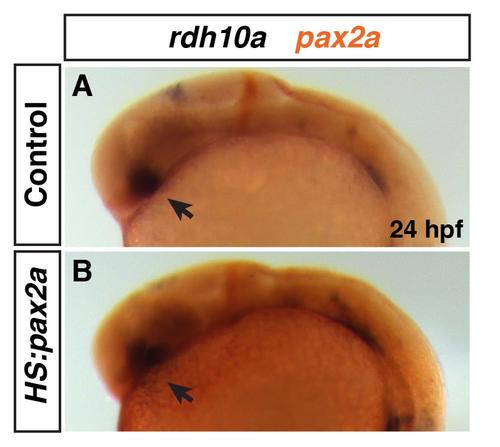
Rdh10a expression in heat-shocked Tg(hsp70/:pax2a) embryos. (A, B) Rdh10a expression (blue) at 24 hpf in heat-shocked control sibling non-transgenic and hemizygous Tg(hsp70l:pax2a) embryos. ISH for pax2a (red) was performed to distinguish between control sibling and transgene carriers. 12 of the 27 embryos did not have ectopic pax2a expression indicating they were non-trangenic, while 15 of the 27 embryos has ectopic pax2a expression indicating they were the Tg(hsp70l:pax2a) embryos. There was no discernible difference between rdh10a expression in the eyes (arrows) of control embryos and embryos with increased Pax2a. |